
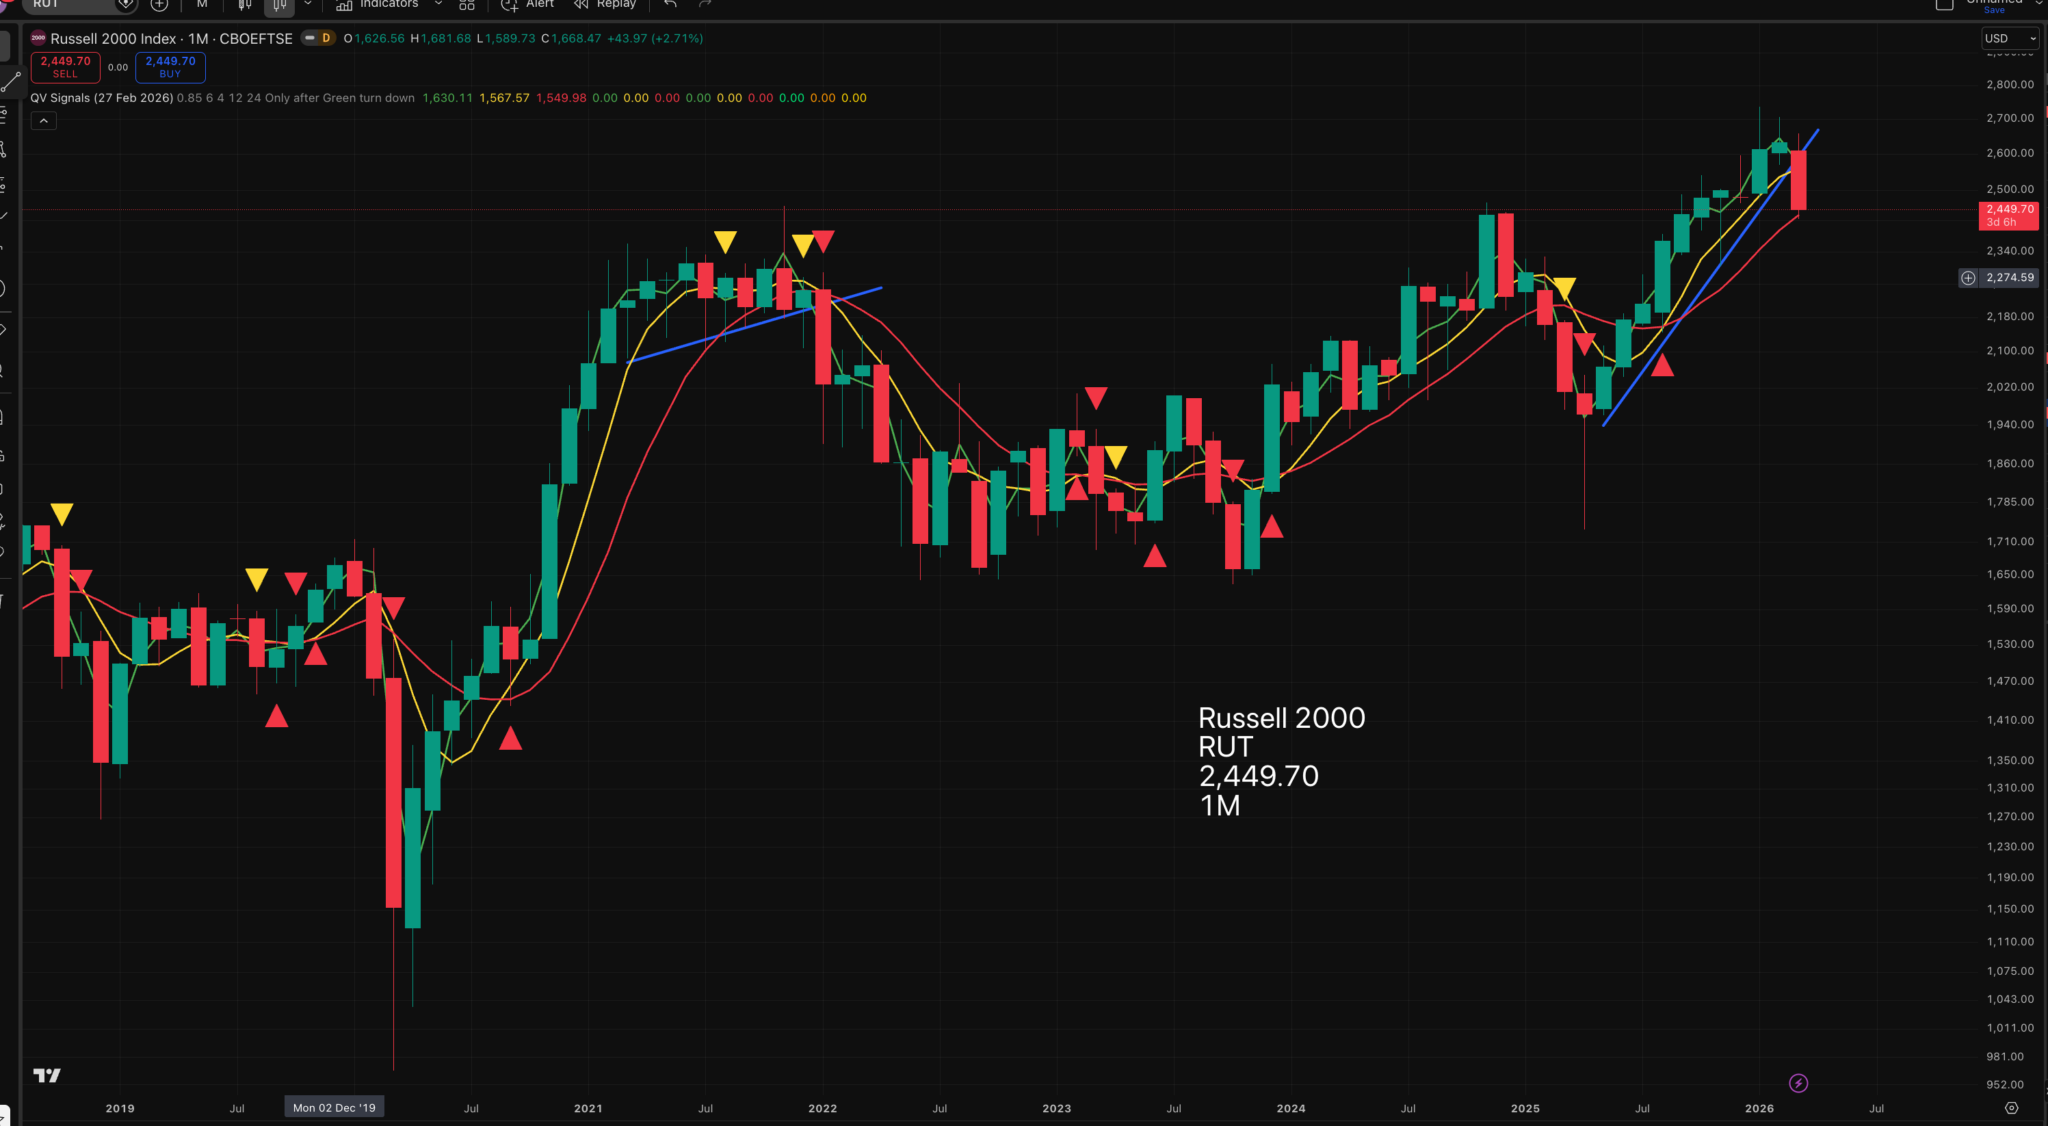
All investment strategies work well with the benefit of 20:20 hindsight. The trick is to see how they perform in real time. The Russell 2000, 2000 institutional-quality shares that are smaller than those in the Russell 1000, has given a TLB sell signal, but the yellow moving average is still climbing.
At least this suggests caution, and with other indices having given yellow line sell signals, the odds are this will happen to the Russell 2000, too.
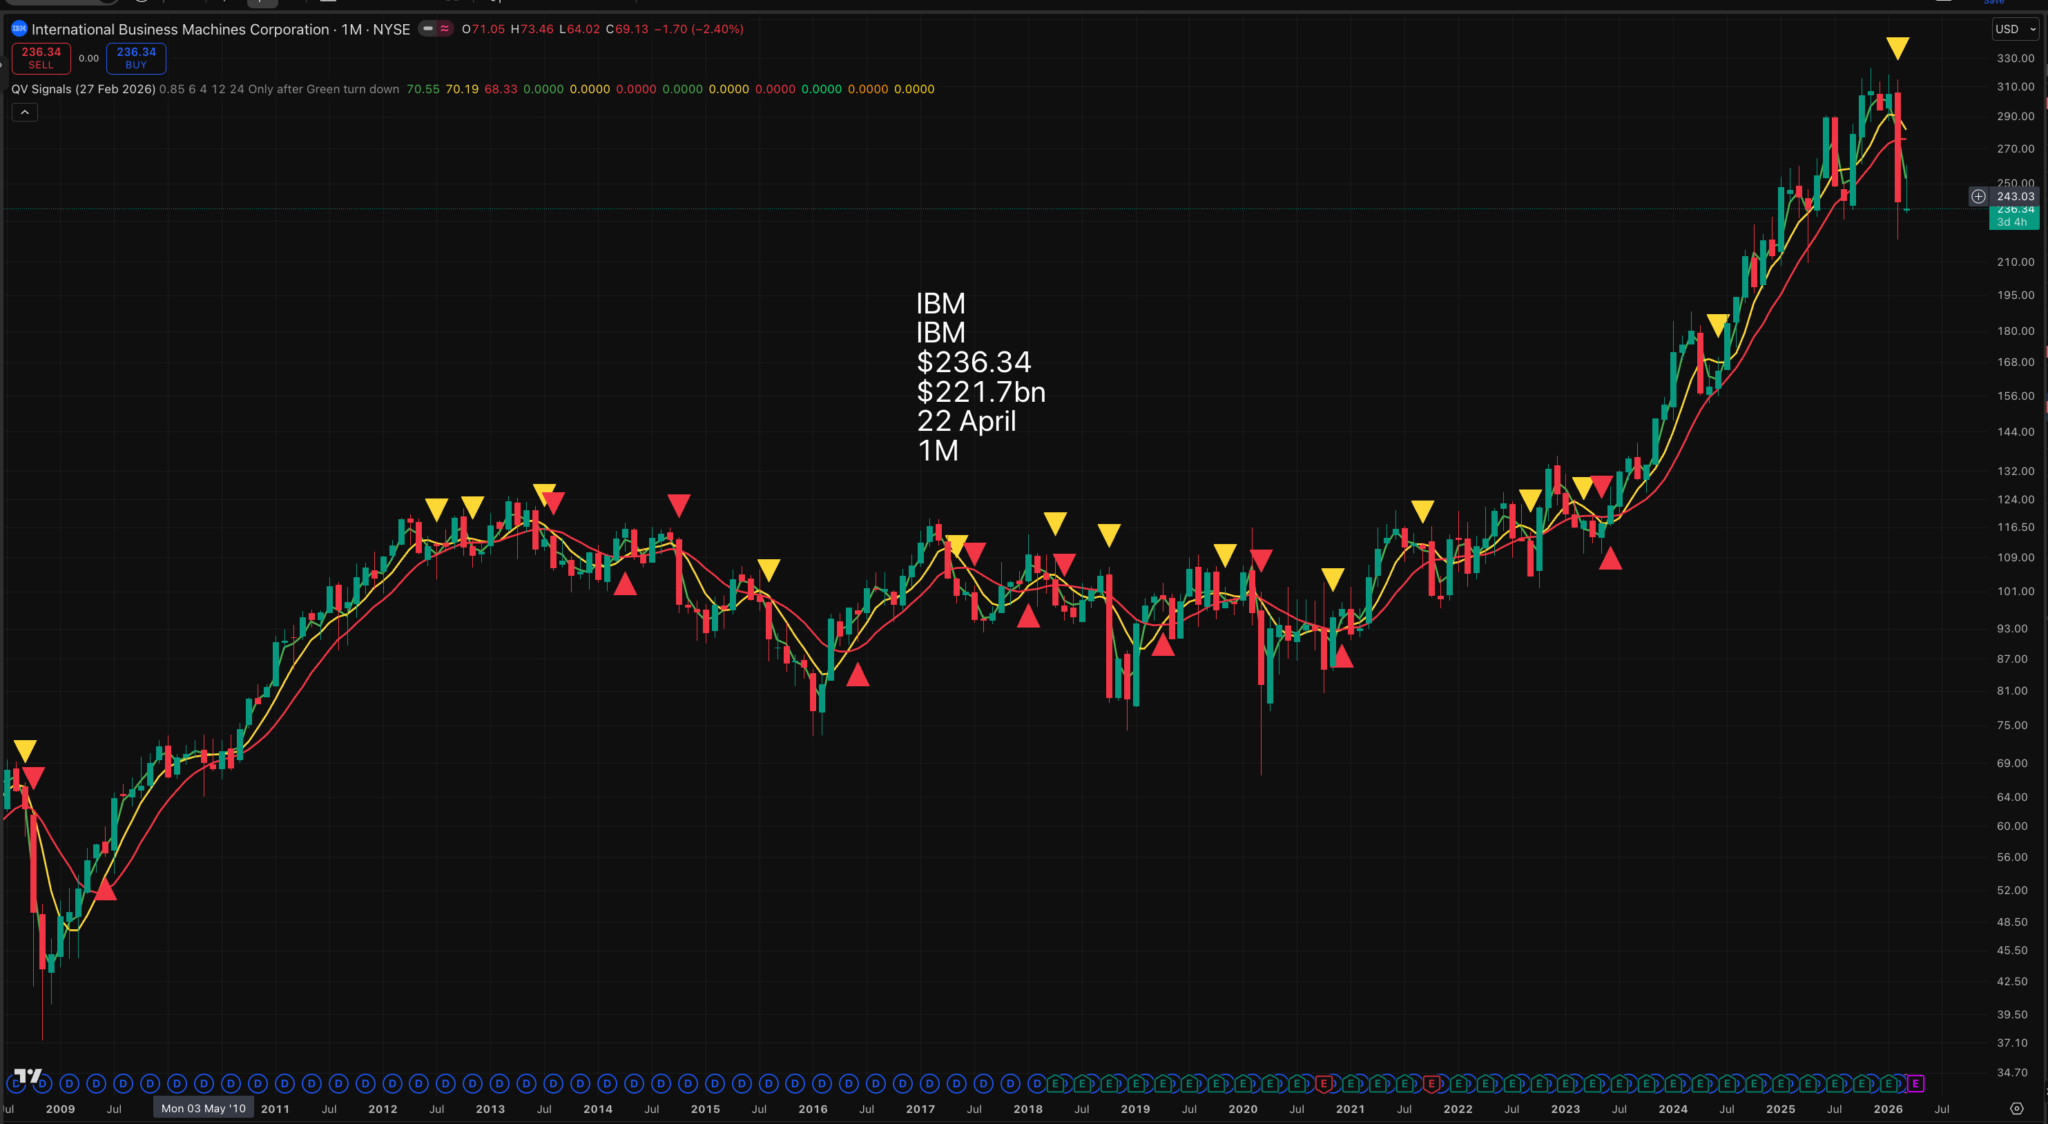
I have picked a chart of IBM, at random, to illustrate how a long trade might work. In June 2023, there was a red line buy signal. A breakout to a new high closely followed this after a long period of consolidation. At this point, I would have studied the fundamentals to find out what was happening, but in chart terms, the shares were a strong buy.
This means we would have opened a long trade, ideally in a spread betting account where all gains are tax-free. We hold the position until we get a sell signal. There was one in June 2024, which was almost immediately reversed and where there was no trend line break. We could easily have held this position unless there was a TLB.
Now we have a YL sell signal and a TLB. We should have closed the long trade, having conceivably doubled our money, certainly with a good profit. My idea is that we look at the whole US stock market, looking for opportunities to execute successful long trades. No emotion, no falling in love with shares, however exciting, just there to make money.
Another clue to the opportunity presented by IBM was that the red line chart steepened in late 2023 (buy signal) and has flattened out now (sell signal).
Part of the analysis of IBM is that in 2023, many shares look bullish. Presently, many shares look bearish, and the indices are rolling over. In this approach to investing, fundamentals are almost a distraction because they invariably look best when you should be selling.
Increasingly, I realise that looking at what an excited CEO is saying about the incredible outlook is a poor guide to whether to buy or sell. The chart is far more instructive.
It takes us back to Descartes and Cogito Ergo Sum (I think, therefore I am). We need to be sceptical of everything except the facts. Charts are facts, opinions are moonshine.
Strategy – The Art Of The Long Trade
Buy and forget is often a great way to invest; it is what the founders of companies do, but it has never worked for me, partly because of leverage and partly because I just can’t handle the inevitable declines.
Equally, I think day trading is a waste of time. It just doesn’t work, like betting on horses, unless you can cheat.
The realistic alternative is what I call the long trade. A successful long trade has three components – the purchase, the holding period and the hardest bit, the sale.
The purchase decision starts with a buy signal. The one I prefer is a red-line buy signal where my longest moving average turns higher after a decline. This is only the beginning of the buying decision.
After a bear market, many red lines will be turning higher. Most of us need to choose which ones to buy. We need to look at the fundamentals for a clue. Is growth accelerating? Is there something new, like a change of management, or a part of the business showing explosive growth? Then we can return to the chart to see if the emerging bull market in the shares has strong velocity in the form of a steepening red line, the steeper the better.
We hold as long as there is no sell signal. In particular, as long as the red line remains in a steep uptrend line.
The sell signal is a combination of a broken trend line, a yellow sell signal, a flattening red line and most damning of all, a falling red line, which tells me that the shares are in a bear market and rallies should not be trusted.
The object of all this is not to buy at the bottom and sell at the top. Only luck can make that happen. What we are trying to do is complete a successful long trade. Buying at a lowish price and selling at a significantly higher price.
We aim to repeat these trades again and again.
The best time to do these trades is during a bull market, so not now.
As I expect you have realised, I am worried about the overall US stock market. Sometimes all hell breaks out in stock markets, and I suspect we may be approaching one of those times.
I watched a film called Margin Call yesterday about the 2008 collapse in financial markets. It is a wonderful film and a vivid reminder of what can happen. The problem back then was that the banks were selling packaged loans, mostly mortgages, some of which were of very poor quality. In the US, borrowers can drop the keys in the driveway and walk away from a mortgage, which can suddenly become almost worthless.
These packaged loans offered higher yields than packages of top-quality mortgages, so they were attractive in a world of falling interest rates where banks were chasing higher yields. There was also an assumption that these loans were somehow backed by the US government. They weren’t, though ultimately, some banks proved too big to fail.
The whole system relied on perpetually rising house prices. When that assumption failed, the whole house of cards collapsed.
The danger with the data centre boom, which is an incredible boom by any standards, is that one of the assumptions on which it is based will prove unsound, leading to a collapse in spending and mayhem in the US stock market and the economy.
The data centre investment boom is a more important driver of US growth than consumer spending. This is an unprecedented situation and creates a vulnerability since consumer spending is relatively stable, but investment spending can be cut off at the stroke of a pen.
A friend of mine, talking about bull markets, says that the plane needs to be flying to crash. This stock market and demand for data centres have been flying. What is alarming is that relentless good news seems to be losing its ability to push share prices higher. Nvidia, the ultimate data centre infrastructure stock, has been trading broadly sideways for nine months and has recently given a yellow line sell signal.
The next report from Nvidia is due on 27 May, and both figures and the outlook statement are likely to be incredible. The fundamentals look rock solid, so I am mystified by what is happening, but that is the future for you, full of surprises. The key is that the red line does not turn down, and especially does not turn down sharply. If it does, watch out.
On a day-to-day basis, shares go up and down, blown hither and thither by the latest piece of news. My coloured lines, smoothing out the price action, help us make sense of what is happening. And what is happening to Nvidia, the world’s largest company by market value, is that the shares appear to be losing oomph.
NVIDIA is a one-product company. It develops and sells GPUs for the data centres used to create AI tokens. One product companies make exciting investments in, but they tend to crash and burn in the end.
One of my first investments was Lesney, a company which made Matchbox toys. There was an incredible boom in demand, and the shares soared. Then, suddenly, at the peak of the boom, the shares collapsed, and it was over. Lesney was a classic one-product company.
The key sign, for Nvidia, that all was well would be an upward steepening of the red line moving average. Until something like that happens, investors should be cautious of the shares. A great chart MUST support great fundamentals.
This sums up the ‘long trade’ approach. Great chart, we buy; not so great chart, we sell.