Catch 22 was a famous book about the Korean War. Many Americans drafted to fight didn’t want to be there. The only way out was to convince the military authorities that you were crazy. The Catch 22 was that wanting to go home and have nothing to do with the war proved that you were sane.
The investment Catch 22 is that when prices are high and rising nobody feels like selling; when they are low and falling nobody feels like buying. Much of what I am trying to do with Coppock and my other indicators is change this pattern and get into a rhythm of selling high and buying low. It takes patience and discipline to do this because you can look wrong for prolonged periods as has happened many times to Warren Buffett.
My impression at the moment is that US stock markets are taking another downwards lurch led by shares such as Apple and Tesla (see charts below).
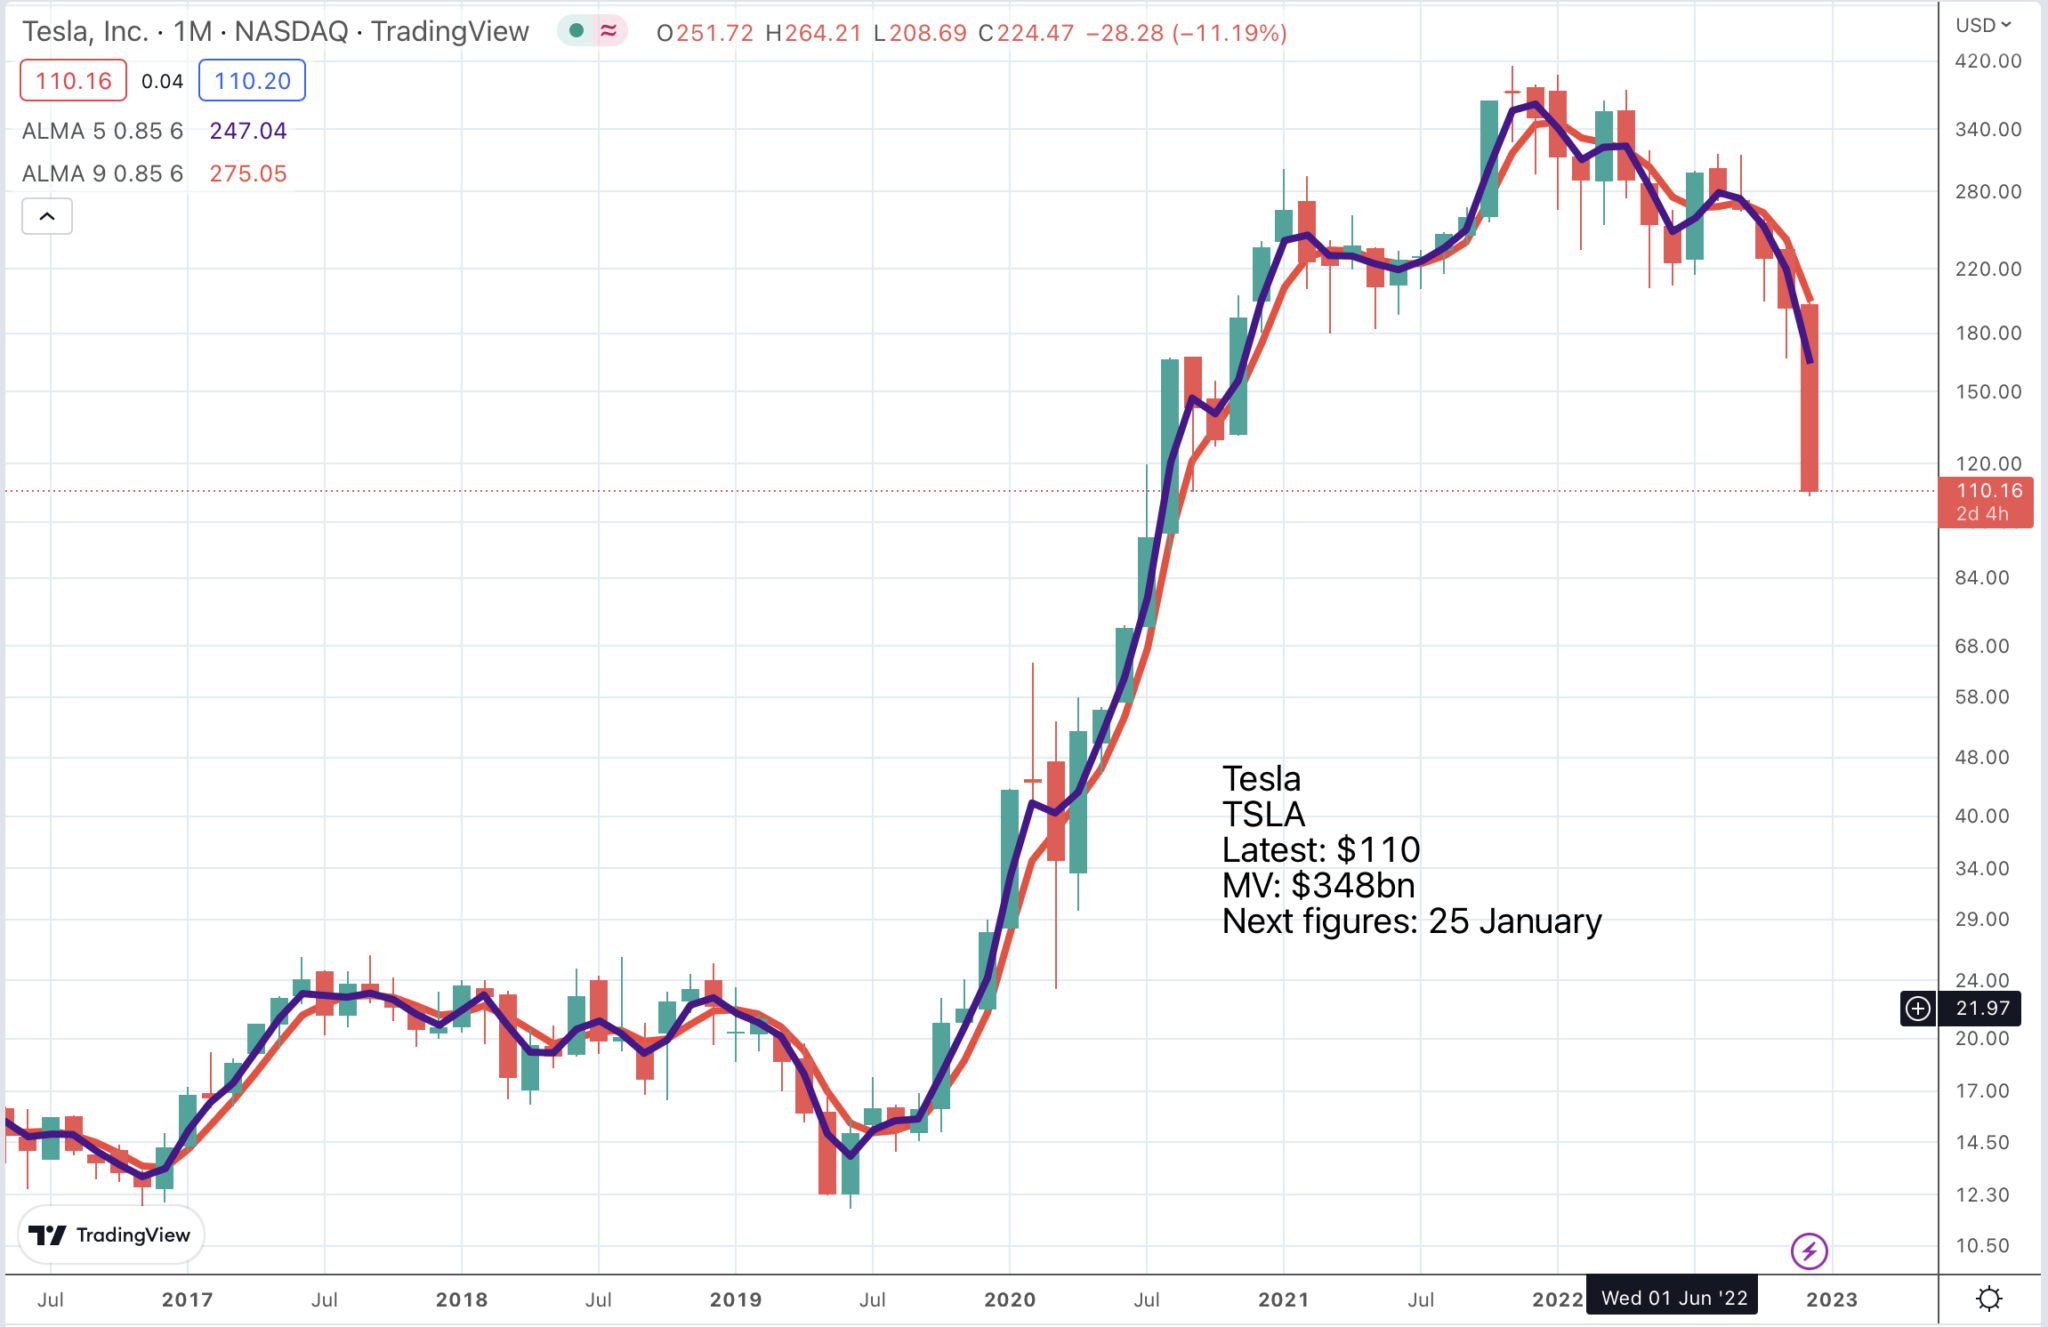
I have been banging on for ages about how terrible the Tesla chart looked. The price is now in free fall. There will be rallies but these shares look headed much lower. It is not about the fundamentals. It is all about more sellers than buyers.
Something similar looks to be happening to the mighty Apple whose shares are breaking down from a massive pattern. Chartists call this configuration of trend lines a fan pattern. It is breaking down below the second trend line and in the process completing something which looks very like a head and shoulders.
This is a bad news pattern. Apple shares could have a long way to fall. The red vertical line shows where the Coppock indicator began falling. The shares carried on climbing for some time afterwards but, as we can now see, were living on borrowed time. In my scoring system both Tesla and Apple and many other shares presently score 0/9.
Tesla looks cheaper on fundamentals than it has for a long time, perhaps ever, but that may only mean that it was fantastically expensive before. It has another problem. One of the first things I learned about the stock market is that many of the most exciting shares are one product companies. Tesla is very much in that category since it generates almost all its sales and profits from selling electric cars. It is vertically integrated and in a world of excess demand for its products does not even need to incur marketing expenses to sell them. But that happy state of affairs is unlikely to last for ever and when one product companies fall from grace the fall is often dramatic.
One I remember from the past was called Lesney which, curiously enough also made cars, ones small enough to fit in matchboxes. It had a spectacular stock market run followed by a spectacular collapse.
Many of the companies that did so well in the recent long bull market were also one product, or effectively, one service, companies, which may help explain the dramatic falls now taking place.
Is Apple a one product company? At first sight it may not seem to be. In fiscal 2021 52pc of its $365bn of sales came from phones but these may be the sales that drive the whole ecosystem. When they do well Apple does well. If they ever became commoditised which seems to happen to most products eventually that could spell trouble for the whole group.
Where Apple does look vulnerable is in its operating profit margins which are extraordinarily high at approaching 30pc but that has been the case for a while.
This is all speculation. The key point is to watch the charts and see what message they are sending. At the moment it is one of extreme caution. Rallies peter out; reactions take the shares to new bear market lows.

There are many scary charts around.

You don’t have to look further than its top 10 holdings to see why ARKK shares are collapsing. Half the portfolio and no doubt more is in shares that are going through the floor. These are shares that signalled long ago on charts that they were going to fall. The reason why ARKK is still holding them is what I am coming to call the fundamental illusion. This is the belief that share prices are determined by fundamentals. They are not. Fundamentals help us choose promising shares but after that it its all about sentiment and momentum and the way to track that is through charts. Take Roku (charted below), which still accounts for 6.48pc of fund assets..

Again I have marked on the chart the month where the Coppock indicator peaked. Almost since then the chart has looked uniformly terrible. I turned bearish about the whole US stock market on Quentinvest on 6 December 2021 (Time to Circle the Wagons) and that was before I had discovered the true power of Coppock. In December you could have sold these shares for $226 after a massive chart breakdown from a perfect double top.
The fact that ARKK has held the shares all the way down is a triumph of hope over experience. This is all about investing with your ego. Because you looked at the fundamentals and thought that the shares were good value at prices well over $200 it becomes impossible to admit that you were completely wrong and the shares may still not be cheap at $39.
Much better to lose your ego and learn to be pragmatic and charts are great for doing that; let the price action tell you what to do. As usual the vertical red line tells you where Coppock turned down.

So coming back to this idea of buying low and selling high. It is a good mindset to have but you have to be clever about how you do it. I am trying to buy low at the moment and frankly getting it wrong all the time. My trick is to get this out of my system with modest amounts of money so it doesn’t matter.
Eventually I will start winning and that is when I will start to commit serious money on the back of making healthy profits. Just looking at the Roku chart which, admittedly, is an unusually perfect example, there has never been a buy signal since the peak.
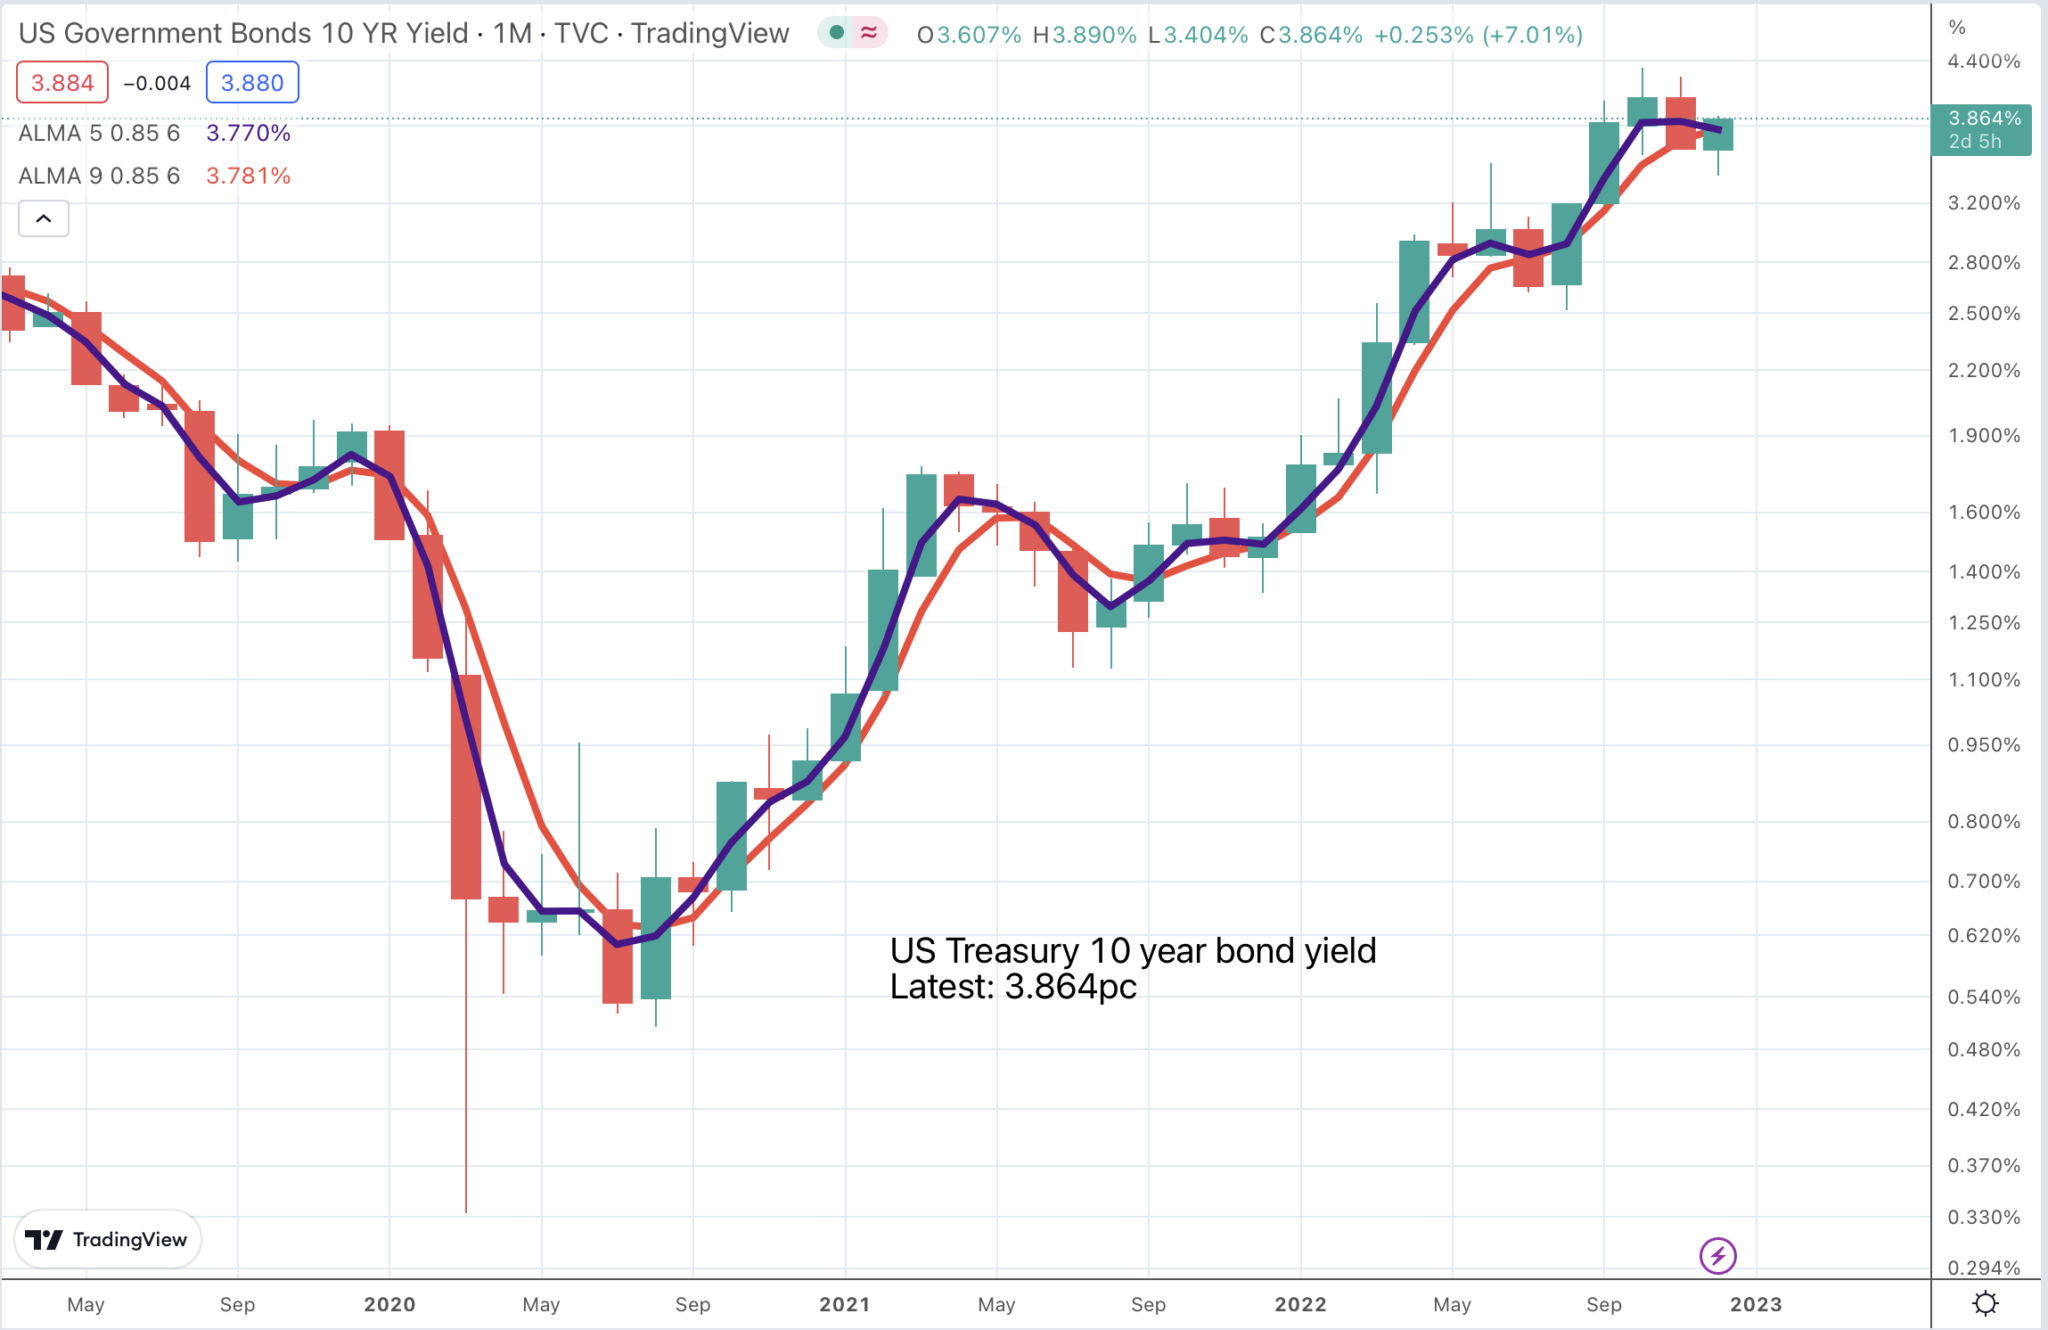
I expect it is still a good business with clever guys in charge and big plans for an exciting future but until that finds reflection in a strong chart there is no point in buying. And the best strong chart is one of many strong charts where investors are spoiled for choice. It is when the whole market turns higher, when ETFs like ARKK, holding Roku turn higher, Roku itself turns higher and charts like that for US 10 year bonds turn decisively lower that it will be time to really get excited about buying shares in a company like Roku.
The chart for US 10 year bond yields (top of the article) is looking very capable of breaking higher (meaning higher yields) which would not be good for shares.
Strategy
What a bear market this is turning out to be. Is this telling us that 2023 is going to be a tough year? Most probably. Falling shares, rising interest rates, bubbling inflation, war in Europe, pestilence in the form of Covid raging in China, a brutal squeeze on middle class living standards all add up to an uninviting prospect.
My Coppock indicators still look like turning higher next Spring but that is still months away. It wouldn’t take too much now to push out the turning point on the Nasdaq 100 Coppock indicator from March 2023 to June 2023.
There are other shares warning of more trouble ahead for the previously high-flying technology sector. Polar Capital Technology was a sensational performer between 2009 and 2021 but is taking a battering now. Like ARKK the guys running PCT are stuck with the fundamental illusion which means they have held share after share in the face of spectacular chart breakdowns.
A problem for all these guys is that they are paid highly for their analytical skills. It is hard to ditch all that for a chart message that anyone can read. The message of this chart, which is one of my key benchmark stocks, is that there is more pain to come.


Incredible Chart/ Fundamentals for Advanced Micro Devices (AMD)

Who’s A Scaredy-Cat!

Stunning Micron Results Keep Memory Boom At Full Throttle