SPDR Dow Jones Industrial Average ETF Code: DIA Quoted in London Latest price: $292.32 Annual expenses ratio: 0.17pc . Tracks: The Dow Jones Industrials 30 Share Average. UCITS: No
‘Despite the name recognition that comes from tracking the Dow and its own popularity, DIA is not the ideal ETF for investors who want broad-based exposure to US large-caps. The fund’s tiny portfolio, arbitrary selection, and antiquated weighting produce significant sector biases relative to the market, and cover only a fraction of the large-cap space, typically represented by hundreds of names. Stocks are price-weighted, not cap-weighted, which can produce major sector realignments when multiple holdings change, as occurred in September 2013. Still, DIA tends to move with the broader market day-to-day, and some may prefer its typically (slightly) lower beta. DIA is extremely liquid, with huge assets and a long track record, and is reasonably priced. The fund’s UIT structure is shared by a few other long-lived ETFs (like SPY), with the most notable effects being a slight cash drag since stock dividends received in between the ETF’s distributions can’t be reinvested as is typically the case. UITs must also hold every stock in the index at all times, which can tie the PM’s hands. Still, for exposure to the Dow—a concentrated, universally-cited basket of household names—DIA is a great choice.’
The above is what one of the ratings agencies says about DIA. The fund has its drawbacks but the expense ratio is super low, its a great way of tracking the performance of the Dow Jones index, which historically has not been a bad thing to do and it has a yield, currently 2.3pc. All the shares in the Dow pay dividends.
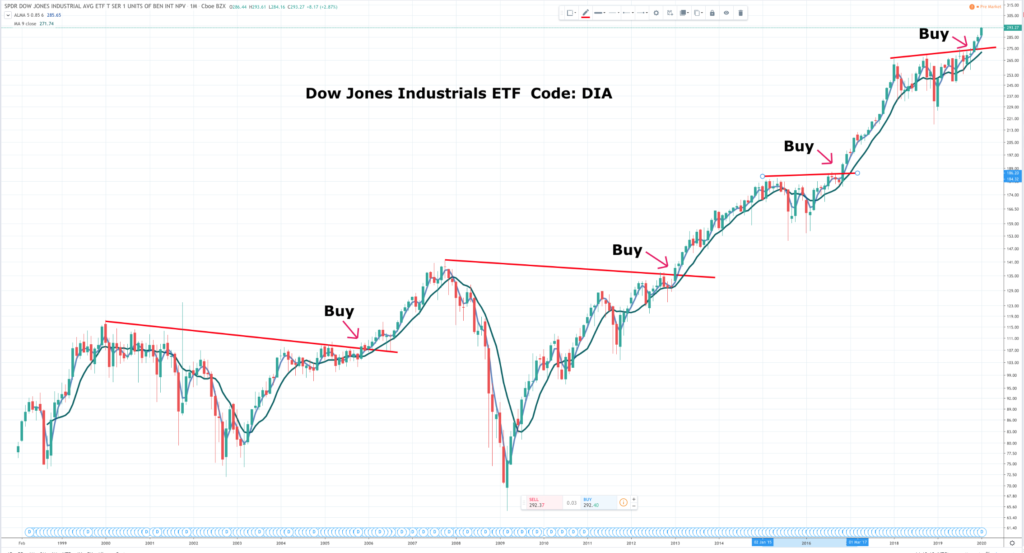
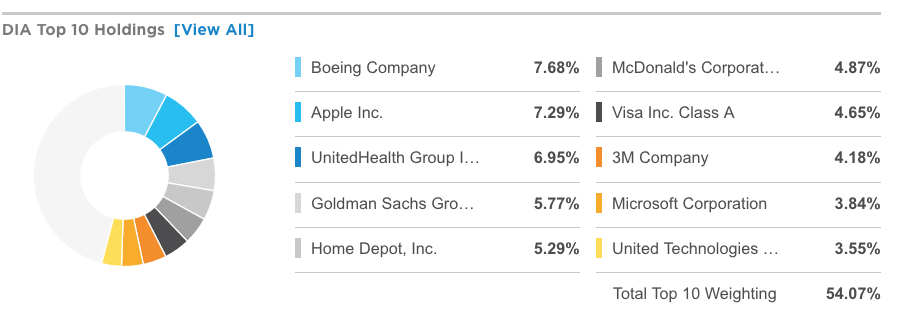
There are some excellent names in the top 10 Dow stocks by market weighting, even if the price based weighting method is archaic. I like the ETF partly because of the names, partly in recognition of an impressive long-term performance but also because of the chart pattern, which looks very bullish.
I have marked on the chart four key breakouts that have occurred within the last 20 years. They typically coincide closely with golden cross buy signals from the moving averages. The basic proposition is simple – sideways, up, sideways, up in endless succession.
The other thing that stands out on the chart is the long period of sideways trading between 1998 and 2014 interrupted by some savage bear markets. This had an important effect in dampening investor spirits. It triggered a huge move of funds into bonds, which enjoyed a prolonged bull market on the back of falling interest rates as inflation died a death. The current era seems more like the Victorian era, when despite sizzling economic growth, prices were as likely to fall as to rise. We don’t have that but we do have extraordinary price stability, which is a huge boon for the global economy.
The long equity consolidation means that we have had an impressive bull market, at least in the USA, without the euphoria that has caused bubbles and massive sell-offs in the past. The current generation of investors is cautious to the point of fearful, always looking for the good times to end. This caution is a major reason for expecting the good times to continue along with great fundamentals like the technology revolution, globalisation, the emergence of a vast Chinese ( and global) middle class with money to spend and in the pipeline the wealth effect as millennials and Generation X cash in on an estimated £59 trillion inheritance windfall.
My own feeling is that we are in the greatest equity bull market in history, which has a long way yet to run. DIA is not a bad way to invest in that bull market at its epicentre in America.

DIA is a new addition to the Quentivest for ETFs portfolio, which I am glad to say, is going very well. The portfolio has the great characteristic , at least so far that there is no need to sell anything. Never selling has so far had a minimal effect on performance and nearly all my recommendations are in profit. You cannot ask much more. What you can do, partly by following my alerts but also on your own account, is to set up some system for adding to holdings on new chart breakouts. You could add more every time the moving averages given a golden cross buy signal or on every new high after a period of weakness/ consolidation. ETFs are good for that because they don’t go bust.

Incredible Chart/ Fundamentals for Advanced Micro Devices (AMD)

Who’s A Scaredy-Cat!

Stunning Micron Results Keep Memory Boom At Full Throttle