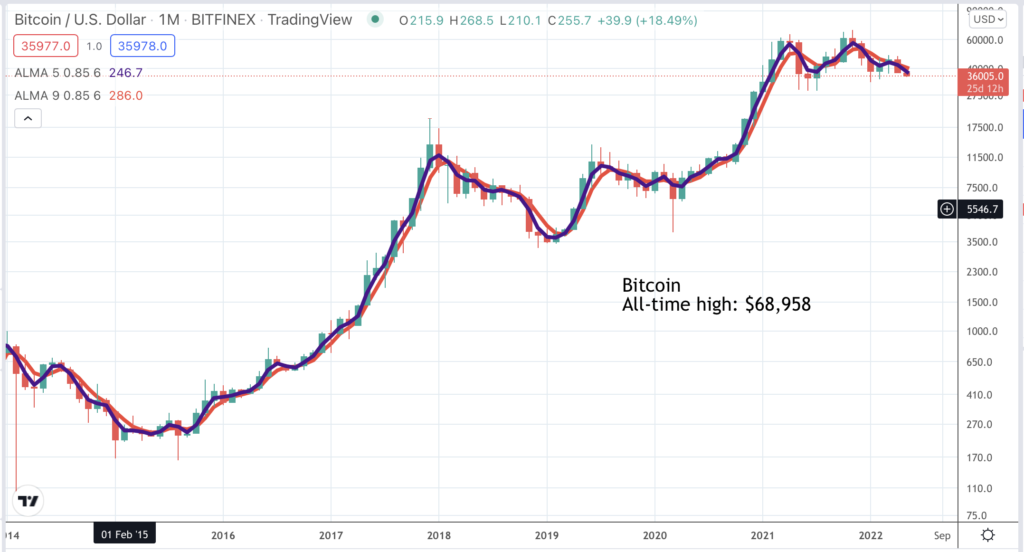
I am beginning to think that just as many shares behave like bitcoin so bitcoin is just another share. It booms with the rest of the stock market and tops out with the rest of the stock market. If this thinking is correct then in the chart above bitcoin may be building a top area from which it is in danger of breaking down.
Unlike shares bitcoin has no fundamentals to offer support if it starts to fall so a breakdown could be a dramatic event. Again this is a simple matter of looking at the chart which shows a classic double top. The first top was in the period, February to April 2021. The second top was in October/ November 2021 when the stock market topped out, at least in the US.
The position now for bitcoin is that the moving averages are falling, the Coppock indicator is falling but not yet in negative territory and any uptrend lines you might draw in have been broken. The thing we don’t yet have is a break down from the possible top pattern.
It is already time to get worried. The time to get very worried would be if the angle of descent of the moving averages was to steepen and a move happened with breakdown characteristics. What does that mean? A sharp down move on high volume. To make the bearish analysis look wrong bitcoin would need to close above $50,000. A buy signal by Coppock would also be a dramatic development for bulls. There is no sign of either of these things happening at the moment.
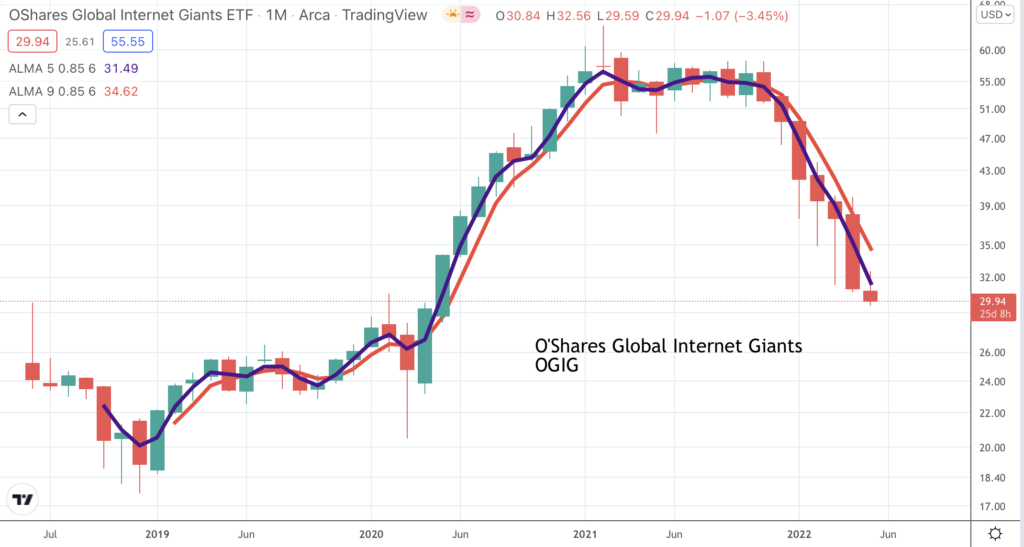
Another interesting chart to look at is OGIG, an ETF focused on exciting technology shares. OGIG topped out in February 2021 which I now see as the first important stock market high point. After falling the shares then rallied through to July 2021 which I now see as the second market peak. Significantly Amazon shares reached their all-time high of $3,766 in July 2021. The final third peak was in November 2021 which was the last time when OGIG shares looked as though they might break higher and Amazon retested its all-time high. OGIG shares broke down in December 2021 and have been falling sharply ever since.
A buy signal for this chart would be encouraging but there is no sign of one yet. The Coppock indicator for OGIG started falling in February 2021 from around positive 200 and is currently minus 50. A Coppock buy signal for OGIG could also be significant for the whole stock market.
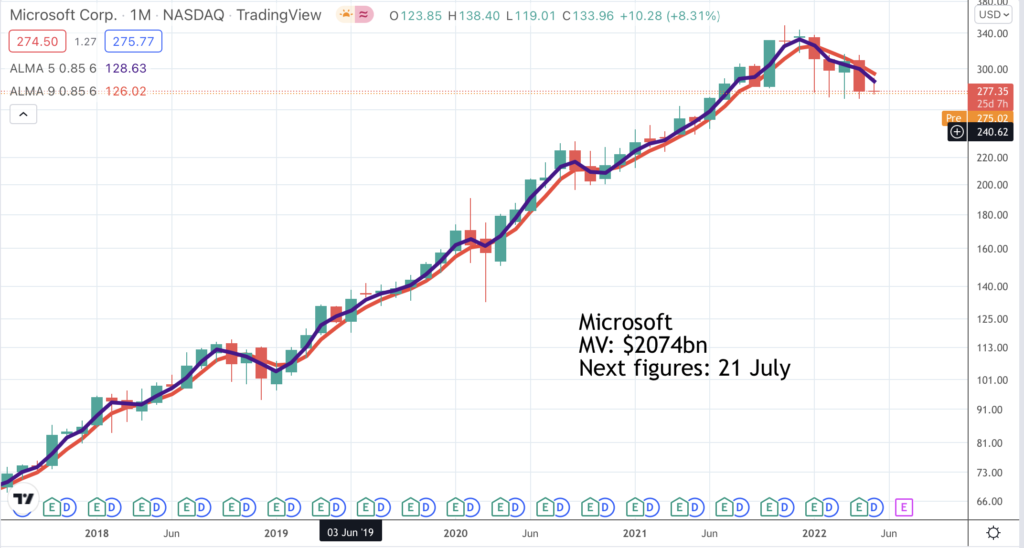
One of the stocks which has been helping the overall stock market hang in there has been Microsoft which peaked in November 2021 but looked as though it might be breaking higher as recently as April 2022. If we look at the chart we can see that Microsoft has built a strong line of support at around $275. If this is decisively broken that would be another problem for shares generally because it would suggest that all the trading since August 2021 was a top area and Microsoft shares would be in a bear market.
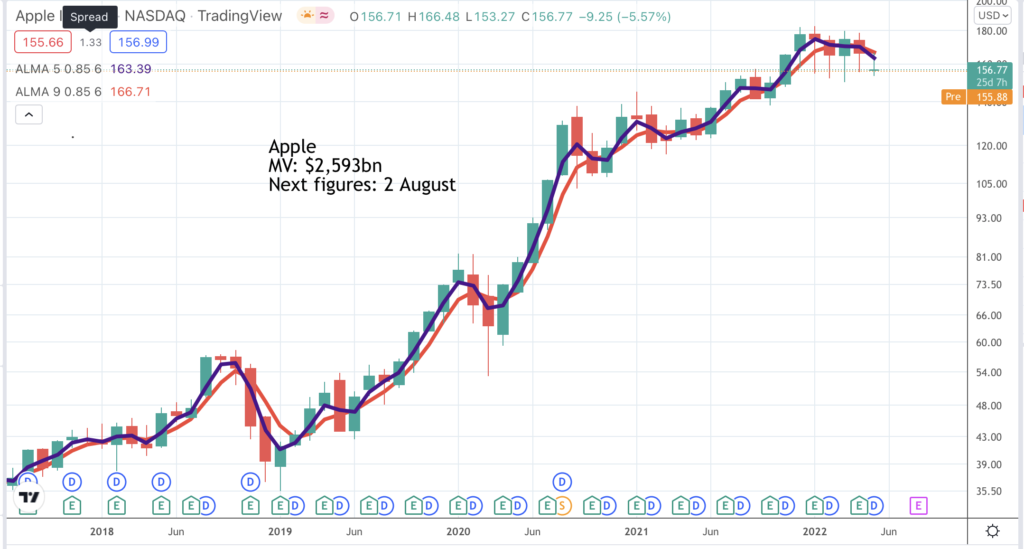
The other big gun helping to hold the stock market up or at least slow the decline is Apple. The shares have support around $155 where buyers have come in and helped the price to bounce on every decline in recent months. If that line of support is broken that would again be bad news for the whole stock market as well as Apple shares. Apple shares are holding up because the business has been trading well. The quarter to March 2022 set new records and was better than expected. “iPhone, Mac and Wearables, home and accessories had their best ever March quarter, and services set an all-time record on the strength of subscription growth over the past year.”
If you read through the results statement the pace of innovation as at least as strong as ever and it is clear that Apple remains an amazing company. “Throughout the quarter, Apple continued its streak of unparalleled innovation at an unmatched pace. With Apple silicon, our teams are pushing the limits of what we once thought possible, and we are seeing leaps and bounds in performance and efficiency.” If the shares do weaken it will be all about macro economic factors and nothing to do with the quality of the business. The same could be said of many exciting technology shares.
It shows how much blue sky there is in share prices which can weaken or strengthen significantly with minimal change in the underlying fundamentals.

Rising interest rates are toxic for cryptocurrencies which do not offer a return. It is also likely that many bitcoins and cryptocurrencies generally are held in margin accounts. Bitcoin broke higher in October 2020 from a large pattern and went on to rise more than sixfold. If they follow the pattern of OGIG, Amazon and others they may now break down from the large pattern built since February 2021. This would be an alarming development for bitcoin investors, for investors in other cryptocurrencies and for investors generally.
The classic pattern is rising inflation, rising interest rates, recession followed by inflation beaten, falling interest rates, recovery from recession. Shares and maybe cryptos perform accordingly bottoming out in the recession in anticipation of the recovery to come.
The easiest way to track all this is through the charts which are becoming an even more important tool for investment success.

Incredible Chart/ Fundamentals for Advanced Micro Devices (AMD)

Who’s A Scaredy-Cat!

Stunning Micron Results Keep Memory Boom At Full Throttle