The FANG ETN is unusual in that it gives undiluted exposure to the biggest names in tech. It holds 10 high profile technology company shares with 10pc of the fund invested in each one. The bad news is that the chart looks terrible. The first Coppock indicator calculations appeared in October 21 (two years after the fund was launched) by when the indicator was falling. Other shoes quickly dropped thereafter. The rising uptrend line was broken in January 2022 and in the same month we had a dead cross on the moving averages.
There are various places where you could draw a line of support to complete the top pattern but wherever you draw it on the chart it has been broken. This is not good news for any of the shares held by the fund. I would be wary of holding any shares in the list of holdings below, even Tesla where I recently said I was having second thoughts about my recent bearishness because of the glittering long-term future for the business. Something is happening in the world which is putting downward pressure on share prices of even the strongest companies.

The safest strategy for all the shares in this list is to be out waiting for a clear 3B buy signal to buy.
I look at some of the individual charts below.
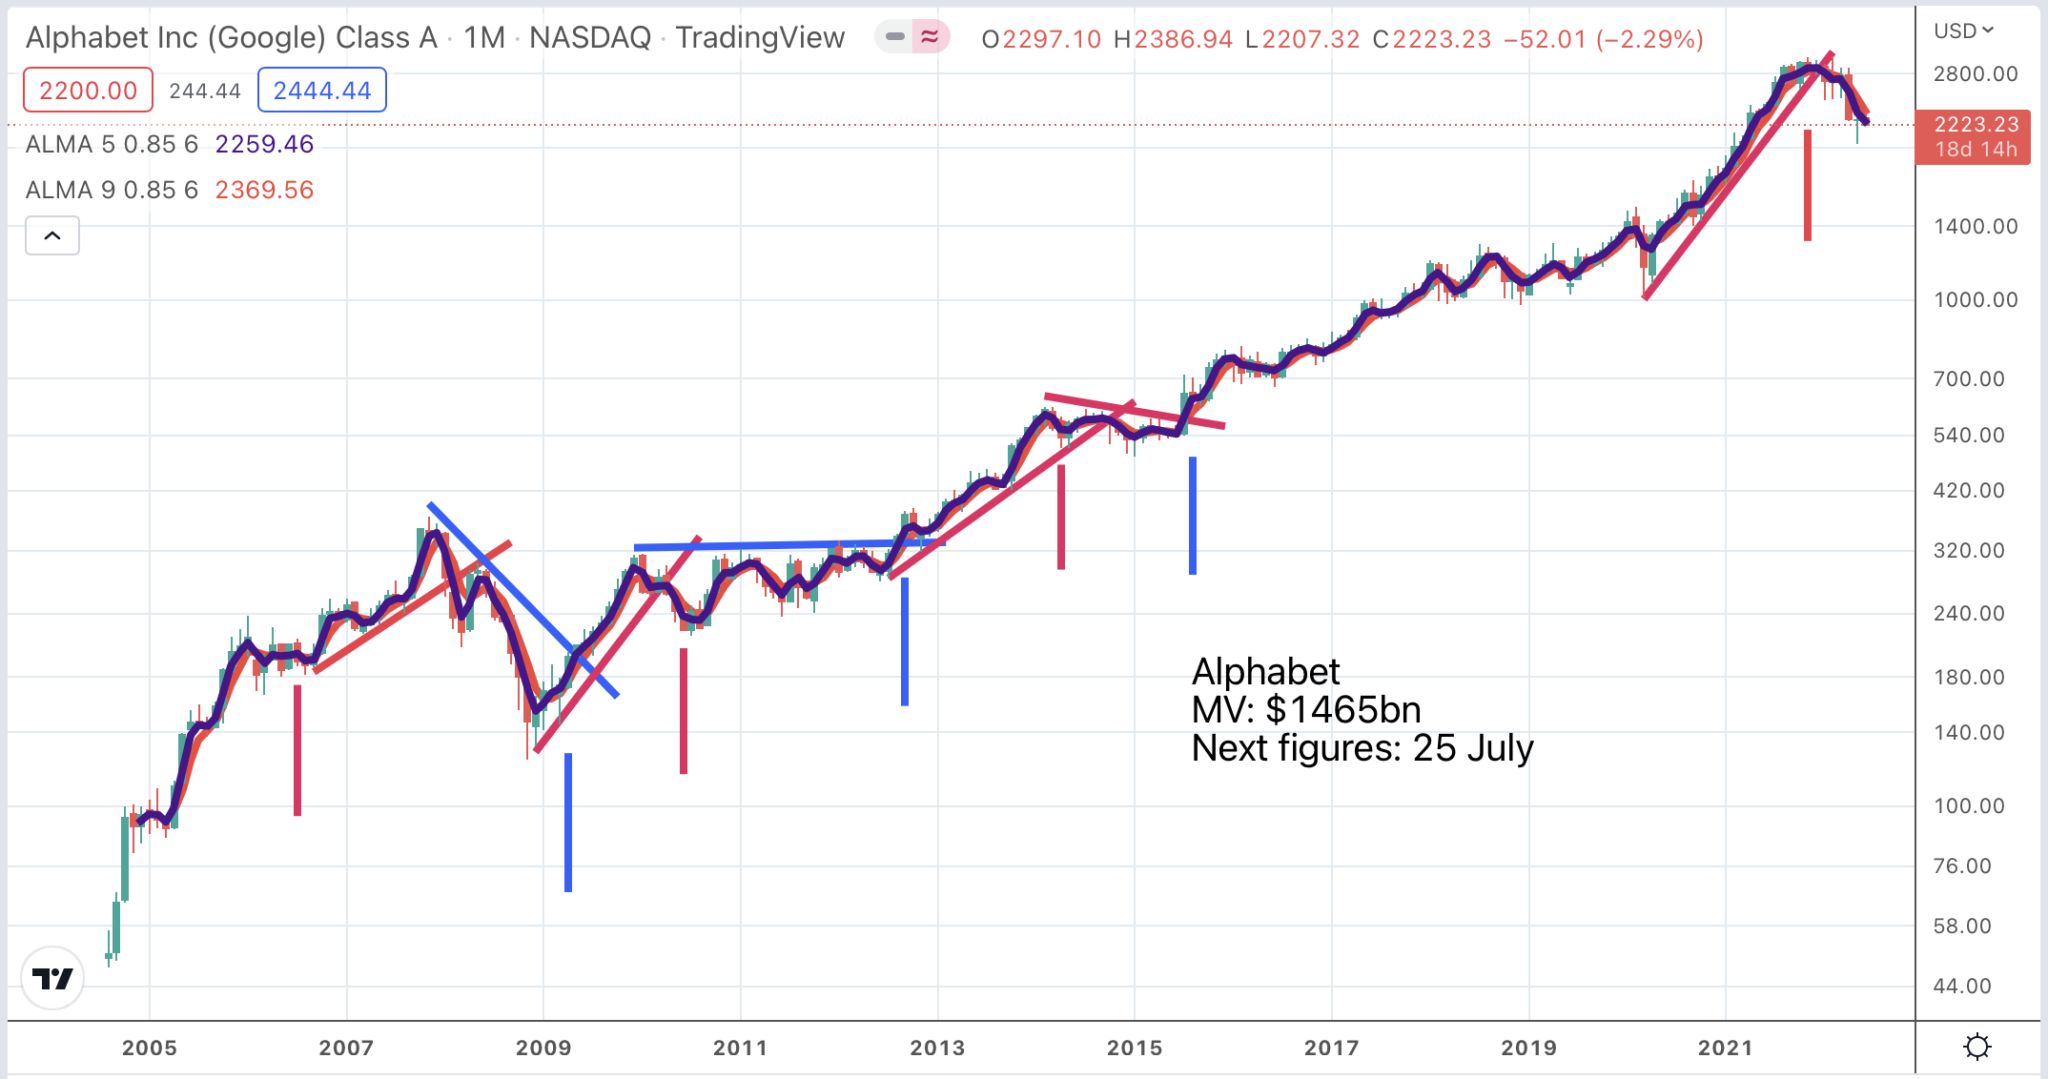
Alphabet, parent company of Google Search and YouTube, owns some fabulous businesses but the chart is negative with a falling Coppock line since November 2021, a broken uptrend line and the moving averages declining in classic bearish formation. Against the background of what has been happening elsewhere in the stock market it would be prudent to be concerned that the shares remain vulnerable. Apple and Microsoft have similar fundamental strengths and similar charts.
The two Chinese shares, in line with Chinese technology shares generally, have already crashed and burned (peak to trough, Alibaba shares fell 77.2pc between October 2020 and February 2022) and show signs of base building with the possibility that the next important move will be higher but there is no sign of that elsewhere among the megacap shares.
Amazon breaks down from massive top area

This is another chart showing a breakdown from a large area of trading. Calculations of how far the shares might fall always seem to take us into mumbo-jumbo land but the best guess is that now the breakdown has been completed the shares will fall a long way and in this market a long way means a very long way. All over the place there are shares which are down 70pc, 80pc, even 90pc from peak levels.
Amazon shares are trading ex a 20:1 share split which means, duh, that a present price around $110 equates to $2,200 in the pre-split form. Both business and shares have come a long way in the new millennium convincing many investors that with Amazon the only way is up. There is plenty of scope for people to become more bearish.
Amazon has never been the most communicative of companies. Bezos did his thing and while it was working so well nobody cared but now there may be difficulties for a management not used to explaining themselves to the world.
There is a hint of margin pressures in the comments in the Q1 2022 results.
“Today, as we’re no longer chasing physical or staffing capacity, our teams are squarely focused on improving productivity and cost efficiencies throughout our fulfillment network. We know how to do this and have done it before. This may take some time, particularly as we work through ongoing inflationary and supply chain pressures,”
Amazon, Q12022 results, 28 April 2022
The implication is that the business has geared up for the dramatic growth in e-commerce triggered by work-from-home and the Covid epidemic and may have too much capacity. Growth at the cloud business, AWS, may also slow which could generate pricing pressures in a hugely competitive market.
The chart is saying this is another share to be out of awaiting a buy signal rather than in stressing over how far the price might fall. Cash liquidity becomes precious in a bear market and needs to be carefully hoarded.
Facebook and Netflix have fallen sharply but with no sign of any reversal.

You can see on the chart for Facebook, now known as Meta Platforms, how well the charts signalled the move to a bear phase. Coppock turned down, the uptrend line was broken and the moving averages began to decline when the price was over $300 versus $175 currently. There is support around current levels but support cannot be trusted in bear markets.
There was quite a strong warning on fundamental prospects in the last quarterly report.
“So over the next several years, our goal from a financial perspective is to generate sufficient operating income growth from family of apps to fund the growth of investment in Reality Labs, while still growing our overall profitability. Now unfortunately, that’s not going to happen in 2022, given the revenue headwinds. But longer term, that is our goal and our expectation. Of course, our priority remains building for the long term. So while we’re currently building our plans to achieve this, it is possible that prolonged macroeconomic or business uncertainty could force us to trade off against shorter-term financial goals. But we remain confident in our long-term opportunities and growth.”
Facebook, Q1 2022, 27 April
Netflix also has an alarming chart and like Facebook/ Meta Platforms has disappointed investors with recent performance metrics. Again the chart signalled the weakness much higher with all my indicators pointing firmly down while the price was still close to $600 against $182 currently. It is always hard for investors to get their heads around steep share price falls. If Netflix was worth $600 eight months ago how can it not be a bargain at prices below $200. But that is what happens when sentiment changes and sentiment is so much of what determines share prices.
Note what has happened to Roku which also has exposure to the video streaming market. It made a classic double top with twin peaks in February 2021 and July 2021, Coppock turned down in August 2021 and in September the uptrend line was broken and we had a dead cross on the moving averages. Since then it has been all downhill with the share price falling 83pc from a peak $484 to the latest price of $82.71. The fact is that sharply as Netflix has fallen it could still fall further. It may be facing a triple whammy of inflation boosting production costs while rising interest rates push borrowing costs higher and competition makes it impossible to pass those costs on to subscribers whose numbers may even decline in an increasingly crowded market.
In the latest quarter it revealed that growth had slowed.
“Our revenue growth has slowed considerably as our results and forecast below show. Streaming is winning over linear, as we predicted, and Netflix titles are very popular globally. However, our relatively high household penetration – when including the large number of households sharing accounts – combined with competition, is creating revenue growth headwinds.”
Netflix, Q1 2022, 19 April
But we don’t have to wrack our brains about why Netflix shares are falling. We can just use the charts and the indicators I favour to help us step aside when weakness threatens and only buy back in when a 3B buy signal tells us that it is safe to do so.

Nvidia wrestles with curse of the charismatic founder
Even Nvidia looks at risk of going lower. It is a wonderful business but in Jensen Huang its shares may face the curse of the inspirational founder CEO. Jensen Huang is a magnetic figure always bursting with optimism and eloquence but you can see how in an excited market with interest rates at almost invisible levels this is a formula for driving a share price to the sky. Now investors see rising inflation running out of control, the associated threat of higher interest rates and a need to dampen demand to match severely restricted supply. All my indicators are pointing down and these shares could have further to fall.
Nvidia is unusual in that the shares continued to rise strongly after Coppock last turned down in January 2021 but that does happen which is why creator, Edwin Coppock was wary of using his creation as a selling tool. I think it is helpful, especially in terms of my buy on a blue, sell on a red strategy. Also, since Nvidia shares broke firmly higher after Coppock turned down we might well not have sold until we had the broken uptrend line and the falling moving averages.
On the basis of my two out of three ain’t bad strategy for using my indicators while Coppock was falling and the other two indicators still pointed higher Nvidia would not have been a sell until April 2022 when all three indicators had turned down. I don’t know where the price is going next but they look vulnerable. Seven years ago the price was $5 and we have seen what has been happening elsewhere in the market. Investors are in full retreat as indicated by the FANG chart.

Strategy
The stock market is giving us vivid evidence of how helpful charts can be. Trying to use fundamentals to predict what share prices will do is less effective except on the broad macro grounds that once interest rates reversed direction from falling to rising the whole structure of share prices became and remains vulnerable. We are in a classic old school bear market driven by inflation running out of control and politicians and policy makers consistently running behind the curve as they try to fight it with instruments like rising interest rates. This battle is further complicated by their desire to meet other policy goals like helping Ukraine win its war against Russia and their over-riding desire to win elections.
Like wars and viruses these are battles that often last longer than anyone at first expects. This bear market may still be some way from being over but we need to be on the alert because shares will turn higher when gloom is deepest and we feel least like buying shares.
This is why we need the charts. They are like our windows into the stock market telling us what is really happening rather than what newspapers and commentators are saying. I am convinced that when this market turns higher for real it will be a time of huge opportunity and I will spot it as early in the process as anyone can expect.
But it has not happened yet. Chinese shares are showing signs of life but that is about it. Everywhere else, especially the high growth, high momentum businesses that I favour, share markets are in full retreat.
The hardest thing with charts is to have the discipline to pay attention to their message. Below is an annotated chart of the Nasdaq 100. As always I must caution that chart reading is much easier with 20:20 hindsight than in real time but even with that proviso they clearly help and are much more useful than weeks of intensive fundamental analysis.
The charts tell us to watch out even while everything on the fundamental front still looks good. We need to have the discipline to pay attention to that message and vice versa when shares turn higher against a background of deep gloom.
We also need common sense. It is by putting all my indicators together and to some extent measuring them against what is happening in the world that we can arrive at a conclusion which is based firmly on the evidence. The chart of the Nasdaq 100 index below shows how helpful the Coppock indicators have been in enabling us to pursue a strategy of buying the blue and selling the red. They also show that we are firmly in red territory now and should be out of the market.

Using charts to predict the future and using them to generate signals are two different things
I realise that I am trying to use charts to do two things. The most important thing I am doing is monitoring charts of shares, indices, cryptocurrencies, whatever and using them to generate buy and sell signals. Based on these signals we can buy on a blue (a 3B buy signal) and we can sell on a red (what we could call a 3S sell signal)
The second thing I am trying to do which is more questionable is I am trying to look at a mixture of indicators and use them like a crystal ball to predict what is going to happen next. This is where many people are sceptical because it involves trying to predict the future and is much more subject to human fallibility – in this case mine.
On the basis of looking at all the charts noted above, perhaps especially that FANG chart, I see further falls ahead. If I am wrong we will start to see 3B buy signals but presently across a wide range of shares, especially the exciting 3G shares in which I specialise, such buy signals are notable by their absence.
One of the simplest rules of all about bear markets, which I read many years ago, is that it is best to assume that they will last around two years. On my argument that this bear market began in February 2021, when Coppock turned down and many shares like the Chinese technology shares hit peaks and began to fall sharply, this bear market has been running for 16 months and has eight months still to run.
Another simple rule is that bear markets begin with rising interest rates and end in recessions. There are many past examples of the latter, 1982, 1992, 2003, 2009 and now maybe 2023? Recessions reduce demand, force companies to cut costs, weed out the weaker players and help to cool inflation allowing interest rates to fall. At the moment demand and supply are out of line, perhaps because of the emergence from Covid, perhaps because of the Ukrainian war, perhaps because monetary easing was too big and lasted too long and perhaps for other more mysterious reasons. It may be quite a job getting these numbers back in balance and the imbalances have struck when share price valuations had become. severely extended, were showing massive profits for many participants and had encouraged an equally massive build up in margin debt. You could say stock markets are being hit by a perfect storm.

Incredible Chart/ Fundamentals for Advanced Micro Devices (AMD)

Who’s A Scaredy-Cat!

Stunning Micron Results Keep Memory Boom At Full Throttle