You won’t need telling that we are in a bear market. The growth stocks that I follow are mostly in free fall. The signs of bottoming out I thought I was seeing have proved illusory. This bear market is still in full flood and could easily get worse before it gets better. For the first time we are hearing talk of recession and this is not a Covid-inspired recession this is a real old fashioned, inflation and interest rates, driven recession. It is like a rerun of Jaws. Just when you thought the beast was dead for ever he comes roaring out of the water.
Markets are oversold so we could see a bounce any time. We often do when I write anything bearish but my indicators are pointing down across the board. My new favourite indicator is the balance of shares in the QV table looking bullish versus those looking bearish. Subscribers will recall that it was this balance which made me turn bearish on 6 December 2021, a stance that was reiterated on 6 January 2022.
I have slightly reformulated my way of making this assessment. I look for shares which I call Unequivocally Bullish v those which are Unequivocally Bearish. Annoyingly the initials are the same for both. In my latest run through, before today’s plunge, there were 37 UBs (bullish) v 231 UBs (bearish) and a handful of stocks in neutral. It is very hard to recommend shares to buy in the face of this weakness. If I didn’t have a publishing schedule I would just go away, keep watching my indicators and come back when the good times return.
In this kind of market even the shares that look unequivocally bullish find it hard to make progress and. may just be holdouts that are going to crack in the end. It is like the famous joke about bear markets that when police raid the brothels they take all the girls.
My Coppock indicators are in free fall. There is nothing going up. Almost all the ETFs I follow apart from contra indicators like oil and gold are plummeting. The cyber security security ETFs are hanging in there helping by stunning sector fundamentals but in bear markets even stunning fundamentals may not stop shares from falling.
I listened to a TED talk with Elon Musk. I didn’t realise that he suffers from Aspergers which is a kind of autism. He really is one weird, unusual guy. This may explain his slightly robotic way of speaking. He is obviously clever and he still has incredibly exciting plans for Tesla. His latest one is robots. There are two key issues with autonomous driving – vision and artificial intelligence. Humans can drive cars because. they can see and they have intelligence so we need to replicate that in digital form for cars to drive themselves. But, once we do, if we give it legs instead of wheels we have robots and Musk thinks that business is going to be huge, bigger than cars and maybe coming sooner than you think.
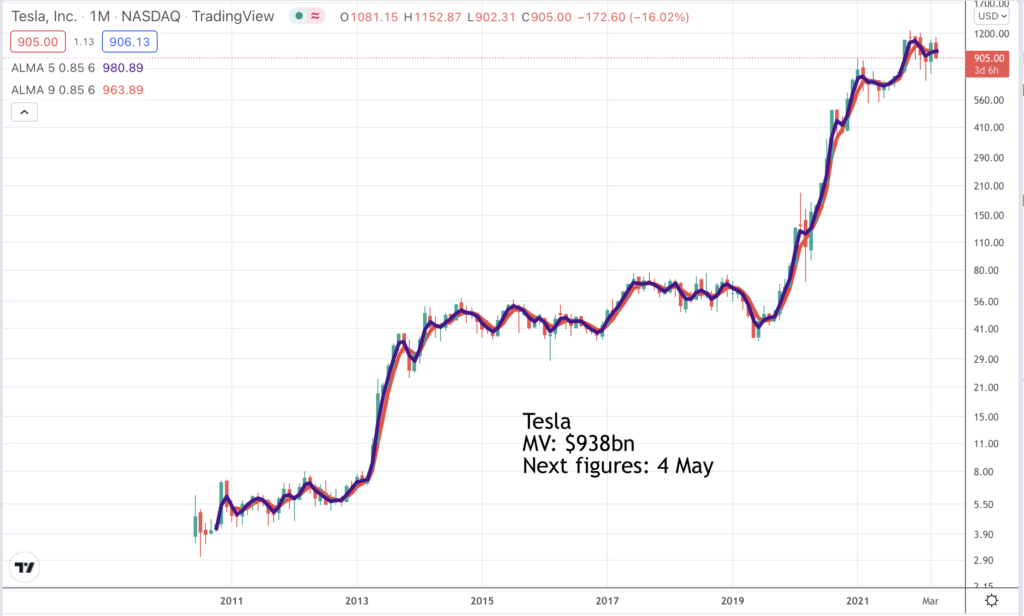
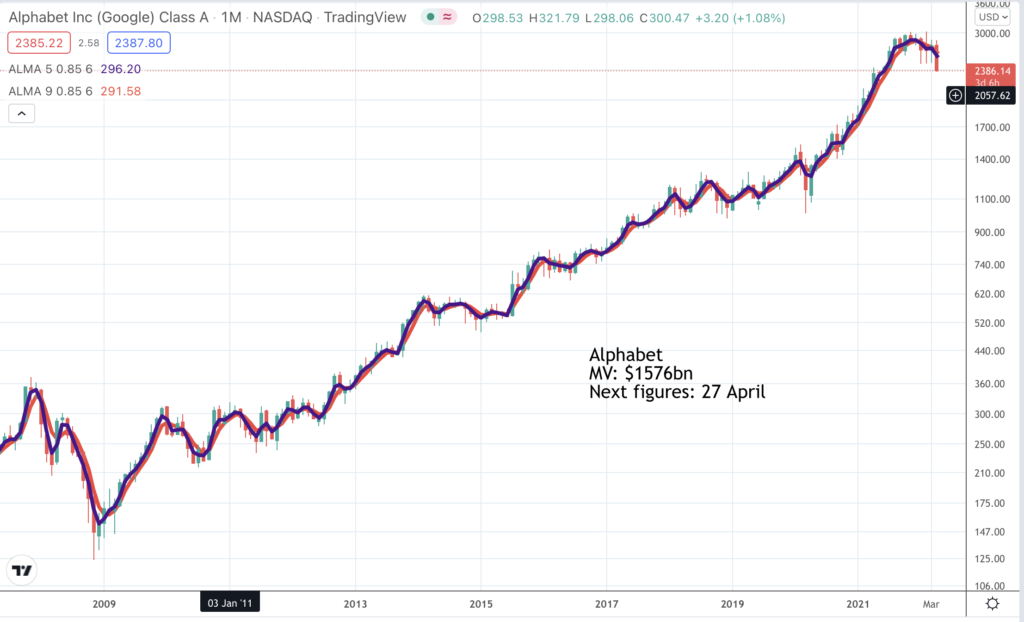
So are Tesla shares going through the roof. Well, they have done enough to be in my UB (bullish) list but they are down $88 today and UB (bullish) could easily become UB (bearish). All the trillion dollar plus market cap shares are now in the firing line. The chart for Alphabet is shown below ahead of results due tomorrow, 27 April.
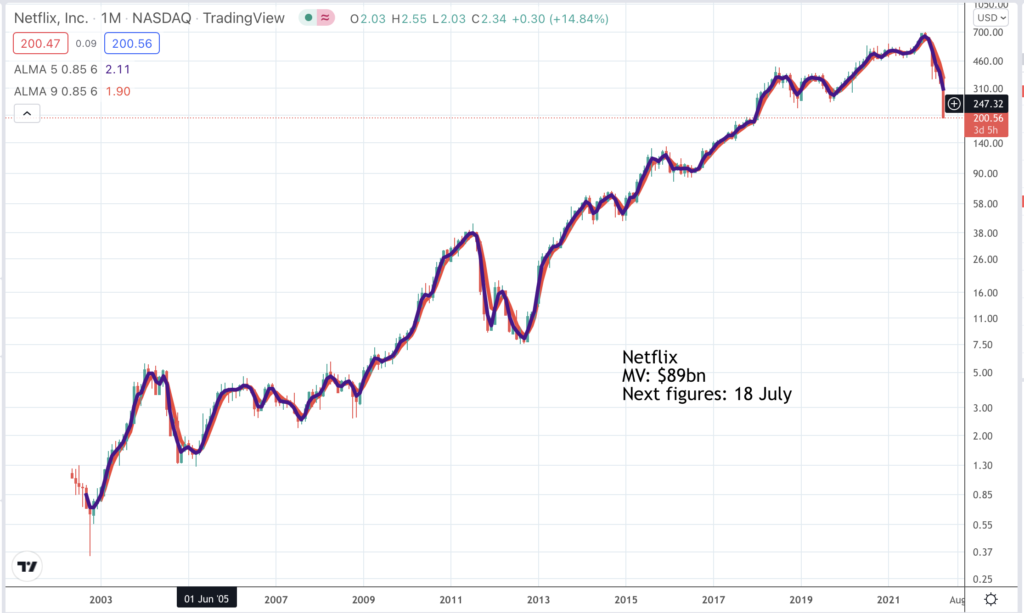
Everyone has been scared by what has happened at Netflix, where the shares plummeted after a disappointing quarterly report. In the latest report the group gave four reasons why growth is slowing – uptake of connected TVs (my recent purchase of one hasn’t been enough to off set slowing growth elsewhere), account sharing on a massive scale (which certainly happens in my family, where we rotate who pays), increased competition as many new streaming services are launched (Disney+, being an obvious example) and pressure on family budgets from inflation, higher taxes, the mad Russian and so on. In itself Netflix is not expensive but households like ours which take Amazon Prime, Netflix, Disney+, BT Sports and whatever else (for my children and grand children more than me) can find the costs adding up though still amazing value for what you get.
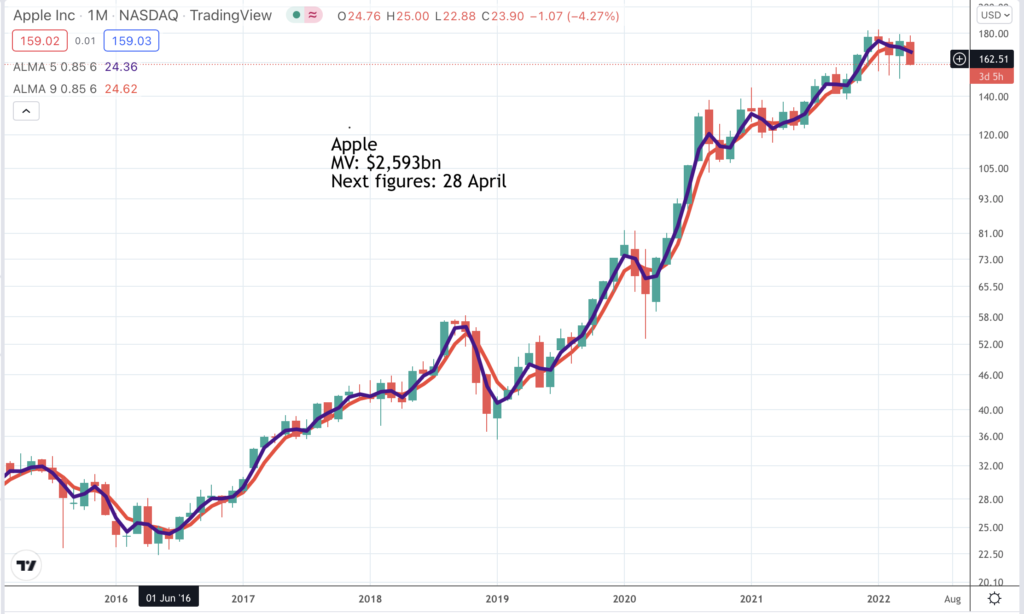
Apple, which is reporting on 28 April, has a neutral chart so doesn’t feature in either of my UB lists but in this market there is no point in buying unless the chart picture improves dramatically. Good news triggers a short-lived rally; bad news means a near-death experience.
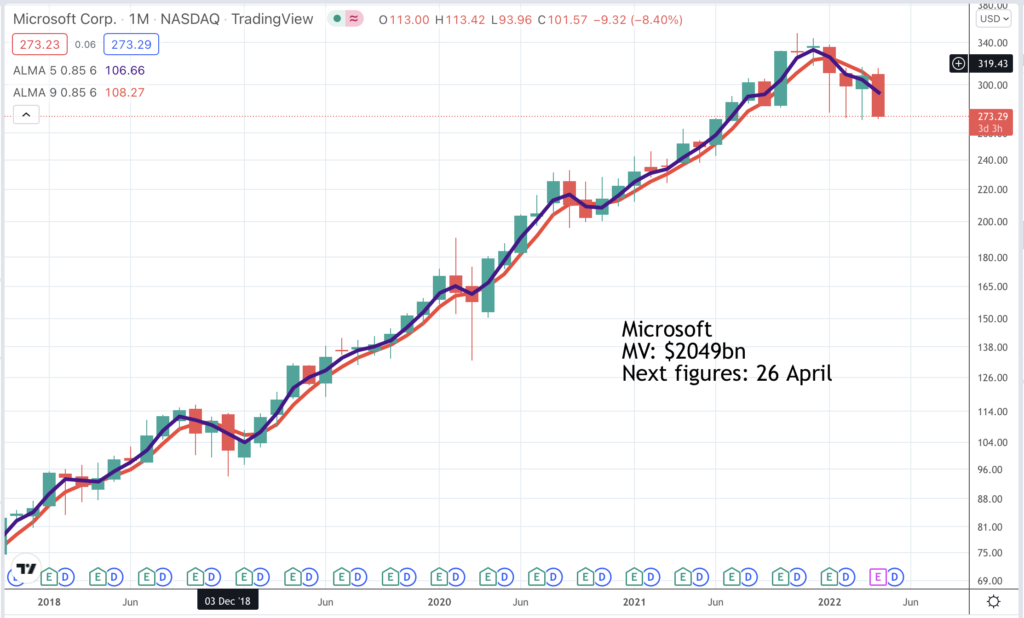
Last of the mega caps is Microsoft which is reporting after Wall Street closes today, 26 April. The chart shown below appears in my UB (bearish) list. Its seems that like the stock market the technology revolution is not going to roll on in an unbroken upwards curve. Most likely there will be periods of super-charged growth such as we have just enjoyed thanks to Covid and work from home followed by pauses to regroup. The stock market may be telling us that. In theory we will learn more over the next several days as the big guns report but that is the problem with a bear market. Good news triggers short-lived rallies; bad news is punished.
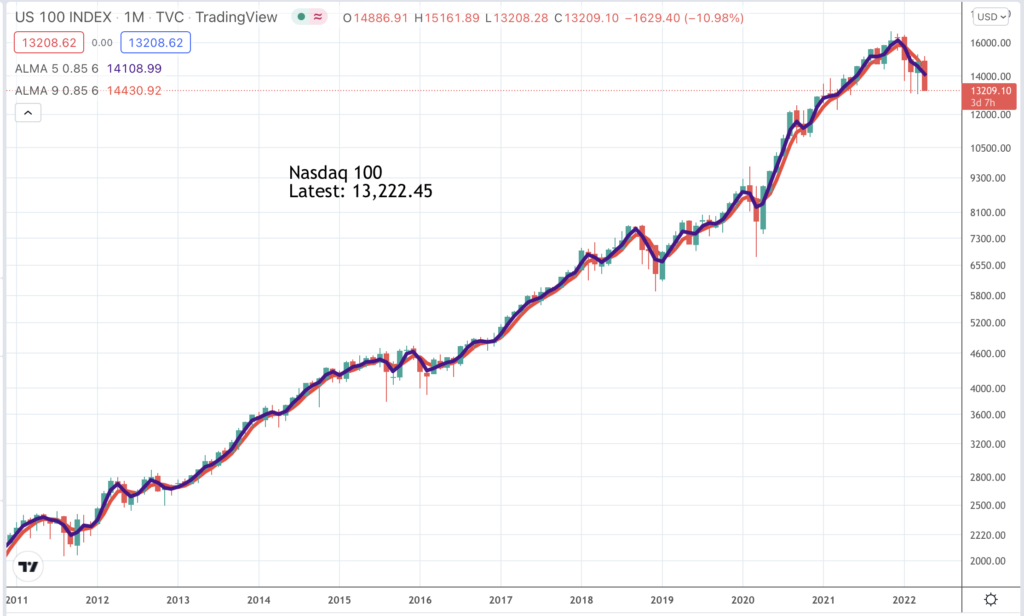
Coppock is an asymmetrical indicator. It can top out and fall for months while share prices continue to rise but when it turns up from negative that nearly always works. So far the Coppock indicator for the Nasdaq 100 has dropped from positive 102 in May 2021, its highest level since March 2000, to positive 36. It has only turned negative for the Nasdaq 100 twice in the current millennium, in 2001 and in late 2008, so if it does turn negative in this cycle, which looks quite likely, the next buy signal would be an important one.
Another indicator that I am developing is bellwether ETFs. I am putting together a group of ETFs (ETFs are passive investments which track indices) to monitor their performance (trend lines, moving averages, pattern analysis, Coppock) and use them to tell me where the market is heading and whether we have a turning point. You will not be surprised to learn that the message from my bellwether ETFs is negative.
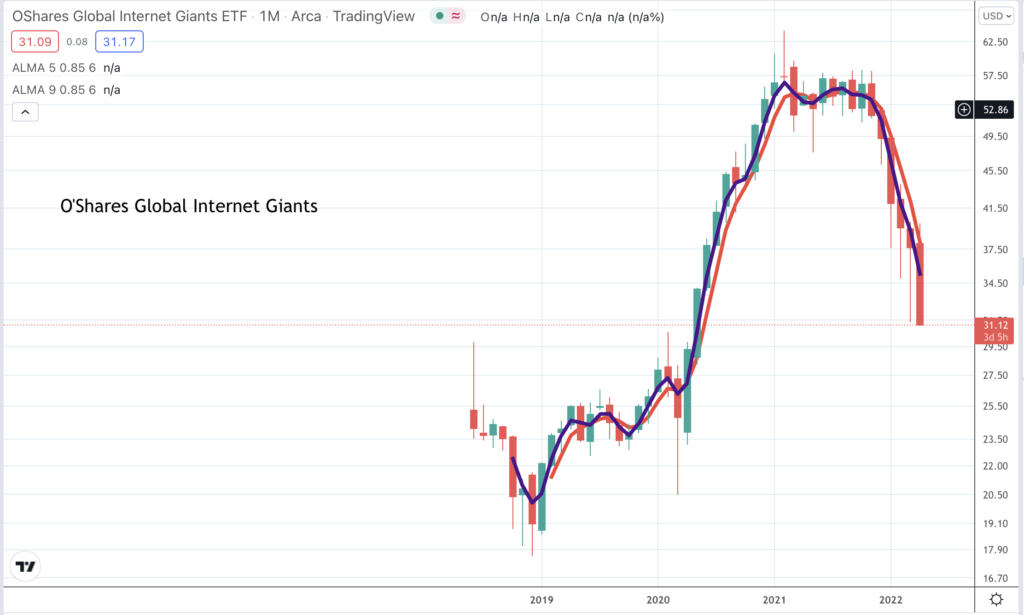
I recently featured the chart for OGIG in Great Stocks (as an example of a bearish chart). OGIG is all about technology shares including big tech, sexy tech (high growth, high momentum smaller companies) and Chinese tech (stocks like Pinduoduo). I am showing the chart again. It looks bloody. OGIG provides an example of the benefits of pattern analysis. In May 2020 the shares broke up from a large pattern and went on to rise strongly. In January 2022 they broke down from a large top area. Before this the moving averages gave a dead cross sell signal in December 2021.
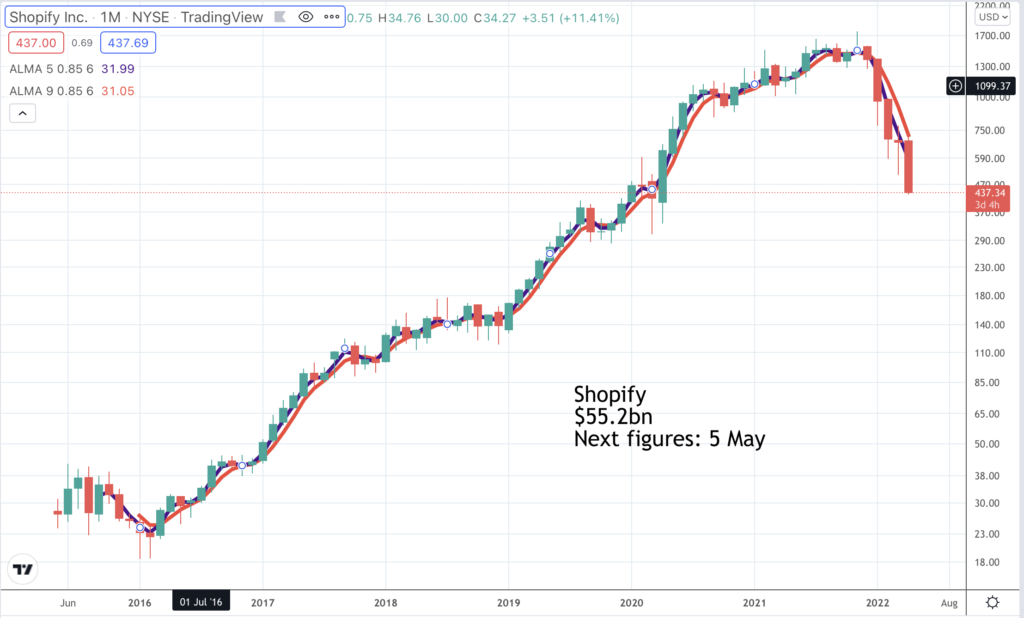
The blood letting is happening everywhere. Shopify was a poster boy of the technology bull market with stunning fundamentals and a stunning chart. Now it is payback time. All the signs are that it is still a brilliant business. This is what the company said about Q4 2021, reported in February. “With commerce evolving faster than ever after the step change brought on in 2020, our merchants adapted and continued to prosper in 2021. Our past investments and execution to build the most modern technology for the future of retail paid off with Shopify and our merchants rounding out an incredible year with a strong fourth quarter. Revenue in our fourth quarter grew to $1.38bn, up 41pc over the same period last year.” But the shares had risen so much from a 2016 low of $18.50 to a November 2021 peak of $1,760 at which point the business was valued at $221bn against 2021 revenues of $4.46bn. With the wisdom of hindsight we can see that Shopify shares and many others in the technology sector flew too high and once a correction starts, especially in a market where many investors are using leverage, the fall becomes self-feeding.
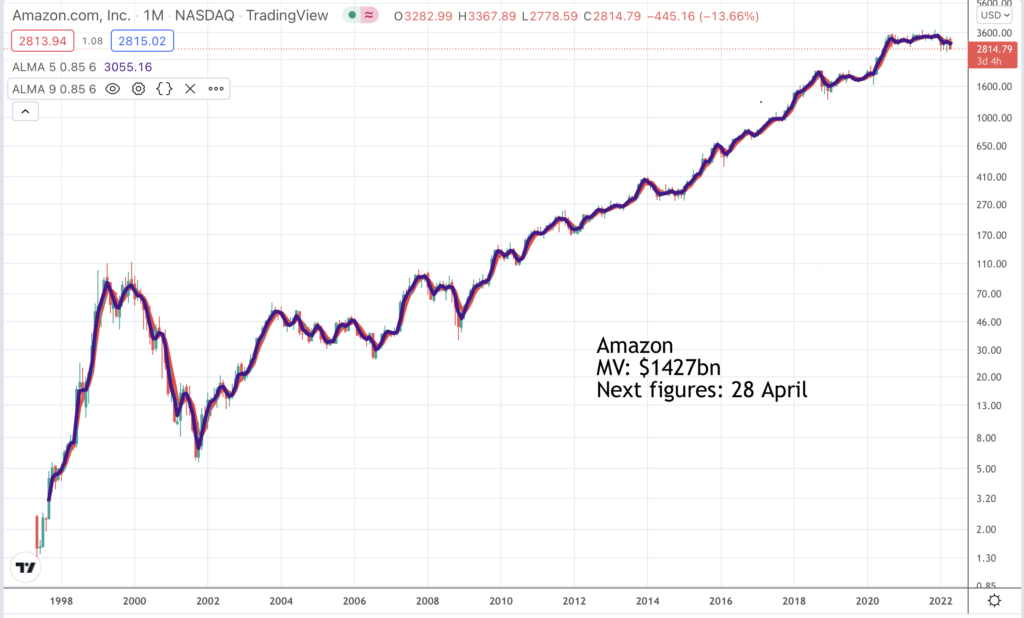
We can see what happened to Amazon early in the millennium. Growth continued as strongly as ever but the shares had climbed too far too fast and were savaged. The big question now is whether Amazon is forming a top area. Given what is happening everywhere else it is hard not to be nervous. The moving averages tried to turn higher recently but seem to be falling again. Results are due on 28 April. This results season could be critical to the health of the stock market and it is hard to be optimistic. There may be a parallel with OGIG. Both shares broke higher out of large patterns in Spring 2020. Since then OGIG has broken down but Amazon is just hanging in there. There are grounds for being wary. and if Amazon starts to fall seriously it is falling below a large top area; that would not be good for these shares and for the stock market generally. A problem for Amazon is that in a more value conscious market a PE ratio of 63 based on expected 2022 earnings offers little protection. Companies may also be less keen on share buybacks if rising interest rates offer a higher return on cash.
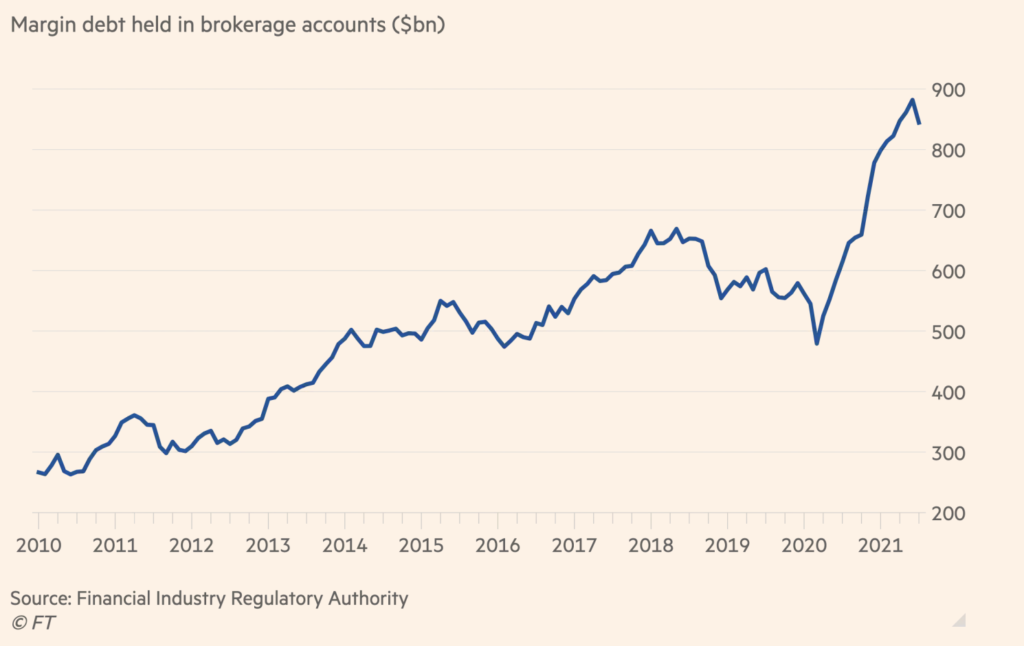
I haven’t seen any recent figures but there must be fears that the great edifice of leverage that has been buoying the US stock market may be starting to unwind.
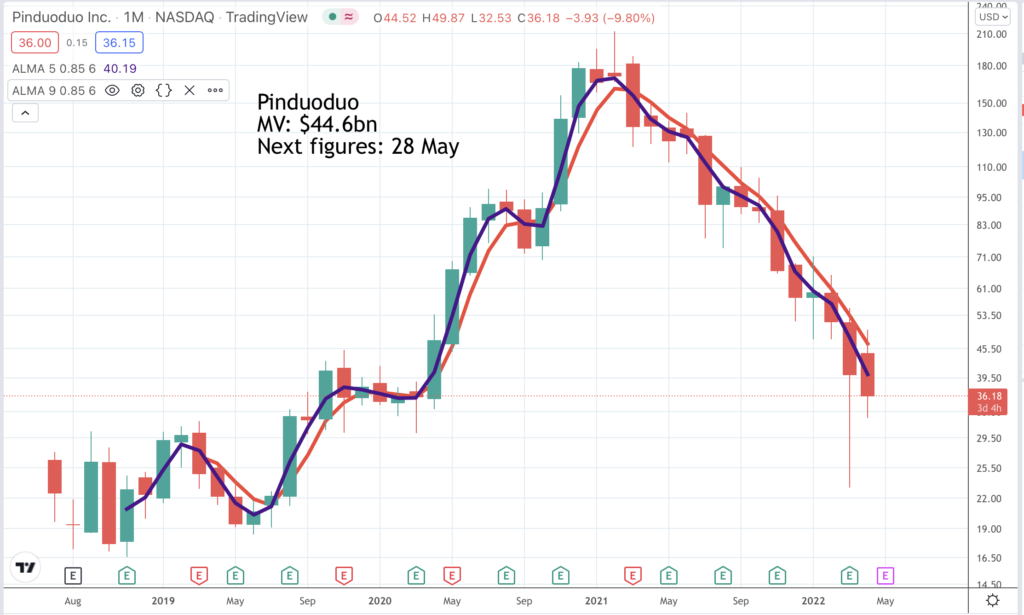
A warning sign for US stock markets which I have mentioned before is what has been happening to high growth Chinese technology shares, which have been slaughtered despite reporting continuing strong growth. Ecommerce business Pindudoduo, which recently overtook Alibaba in numbers of monthly average users, is a case in point. “Our total revenue in the fourth quarter, excluding revenue from merchandise sales, was RMB27.1bn. This represents a year-on-year increase of 28pc. Our annual active buyers reached 868.7m for the 12 months ending on December 31, with 733.4m average quarterly MAU [monthly average users]. Our GMV in 2021 was RMB2,441bn, representing 46pc year-on-year growth. Total revenue for 2021, excluding revenue from merchandise sales, was RMB86.7bn, representing 61pc growth year-on-year.” A problem is that growth is slowing and the figures look backwards rather than forwards. Share prices are all about the future.
The chart shows the difficulty of trying to invest in a bear market. Better than expected quarterly figures triggered a sharp rally from an oversold position but the rally hasn’t been sustained and was never strong enough to change the direction of the moving averages. A Coppock indicator for Pinduoduo has been falling since February 2021 when it peaked at positive 602. The latest figure is negative 110.
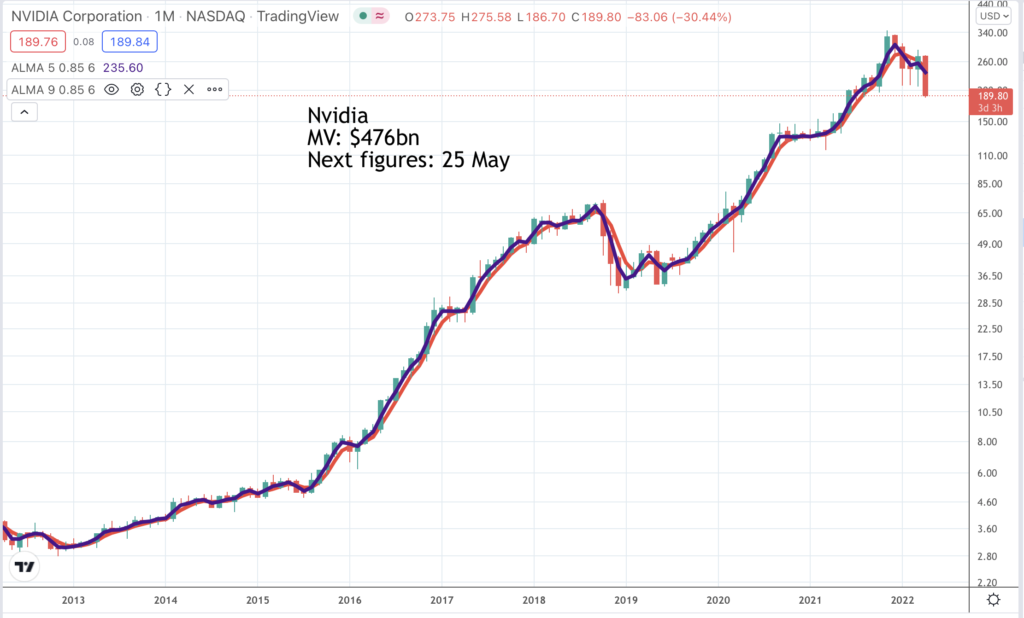
Another big stock which is looking alarming is Nvidia. It seems to be breaking down from a top pattern. Like Shopify, Nvidia has had an incredible run leaving huge profits to be taken by early investors. Even now the shares are up 599 times from the 1999 low point. At the November 2021 peak the shares were up 1,000 times.
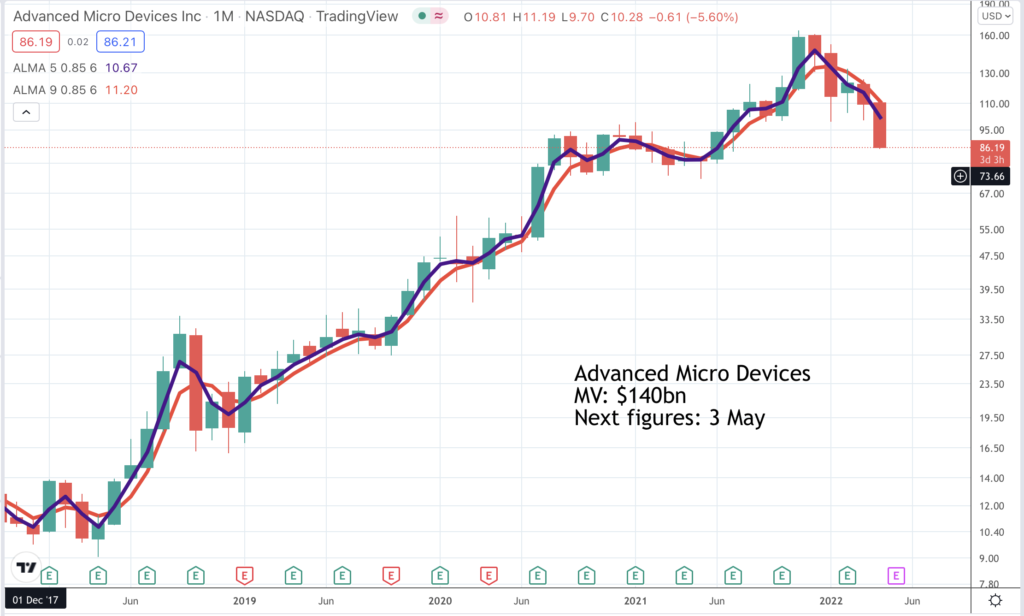
Other stocks in the sector are also showing signs of breaking down including Advanced Micro Devices. The shares are testing a period of strong support but a feature of bear markets is that support levels cannot be trusted.
The chart for Taiwan Semiconductor Manufacturing (TSM) shows a breakdown from a substantial top area. This does not bode well for the whole sector. The TSM Coppock has been falling since May 2021 and is close to negative territory so we should have an interesting buy signal at some future date but no sign of a turning point yet. On the contrary these shares look as though they have further to fall, perhaps a long way further with no support above $50.

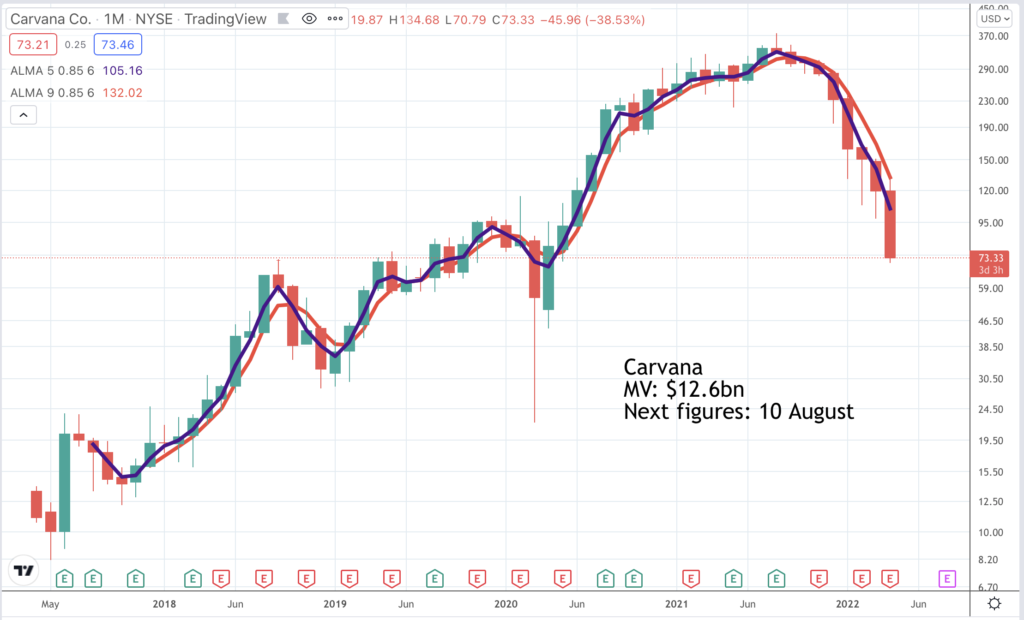
You can almost pick charts at random in this market and they will look bearish. Carvana is reinventing the way used cars are bought and sold in the US. It is run by a group of Stanford and Harvard alumni who are much better educated than the average used car salesman and have shown their talent to blistering effect with the growth of Carvana. Possibly in a sign of what lies ahead for other high-flying businesses, Carvana’s latest quarterly results were disappointing and the shares fell heavily.
The bottom line of all this is that a period of supercharged growth for many businesses may be coming to an end. The technology revolution continues as strongly as ever and is surely going to be the dominant driver of change in coming decades. But maybe there are parallels with the Victorian railway boom, which drove a soaring boom and bust in share prices. Shares fell as the industry moved into a consolidation phase but that did not mean that our lives were not transformed by the railways. They clearly were. Just because technology is transforming our lives doesn’t mean shares will rise all the time. It seems booms and busts are still with us.
In case it is not obvious I am not recommending any shares in this issue. Charts are for information only.

Incredible Chart/ Fundamentals for Advanced Micro Devices (AMD)

Who’s A Scaredy-Cat!

Stunning Micron Results Keep Memory Boom At Full Throttle