Part of my job as a stock market commentator is to offer subscribers my views on where the stock market is heading. This is not easy because it involves predicting the future and I don’t have a crystal ball. What I do have is my indicators and they can do a surprisingly good job.
The one to which I am attaching increasing importance is the balance of uptrends to downtrends in the QV for Shares and QV for ETFs tables. I update these at roughly monthly intervals and in early December I noticed that for the first time in a long time the balance had turned strongly negative. This led to my 6 December QV for Shares alert entitled ‘Circle the wagons’ where I suggested that subscribers might even consider going liquid. The alert, as so often happens, was followed by a strong albeit short-lived rally. Shares in Shopify reached $1,574 on 7 December.
A month later, following my next monthly update of the table I sent a further alert headlined ‘Charts look terrible’, which was again followed by a rally that did not last. At this time the Shopify price was $1,195. They are currently $694 and have been as low as $585. Many other exciting shares have also taken a beating. Cloudflare was $160 on 7 December. It is currently $116 having been as low as $76. This is despite reporting great results and raised guidance on 10 February.
Both these shares and many others are still in downtrends although Cloudflare is performing in a way that suggests that when investors do turn positive its shares will quickly reach new highs. It is a fabulous business and will surely have its reward in time. In a recent of Great Stocks I wrote about a number of shares where the fundamentals look as amazing as ever even though the charts look weak.
A striking general feature of this market is that shares, especially those in high momentum growth shares, are taking a beating but the results they are reporting are as good as ever and they still look like incredibly exciting businesses – still very much 3G (great chart, great growth, great story) if you like but with short term charts that are pointing down leaving me waiting for a buy signal.
There is some sorting out taking place with shares in some previously exciting businesses getting hammered and others holding up better. In general, my bias is always towards the stronger performers but I suspect that a surprising number of former technology favourites are going to emerge from the bloodletting with their growth stories intact.
If I am right this would be in sharp contrast with the post 2000 sell-off when only a handful of survivors emerged after a vicious sell-off in the Nasdaq Composite. I am very hopeful that it will eventually turn out that even investors who didn’t sell anything will emerge holding some exceptional performers which will more than make up for the ones that don’t recover.
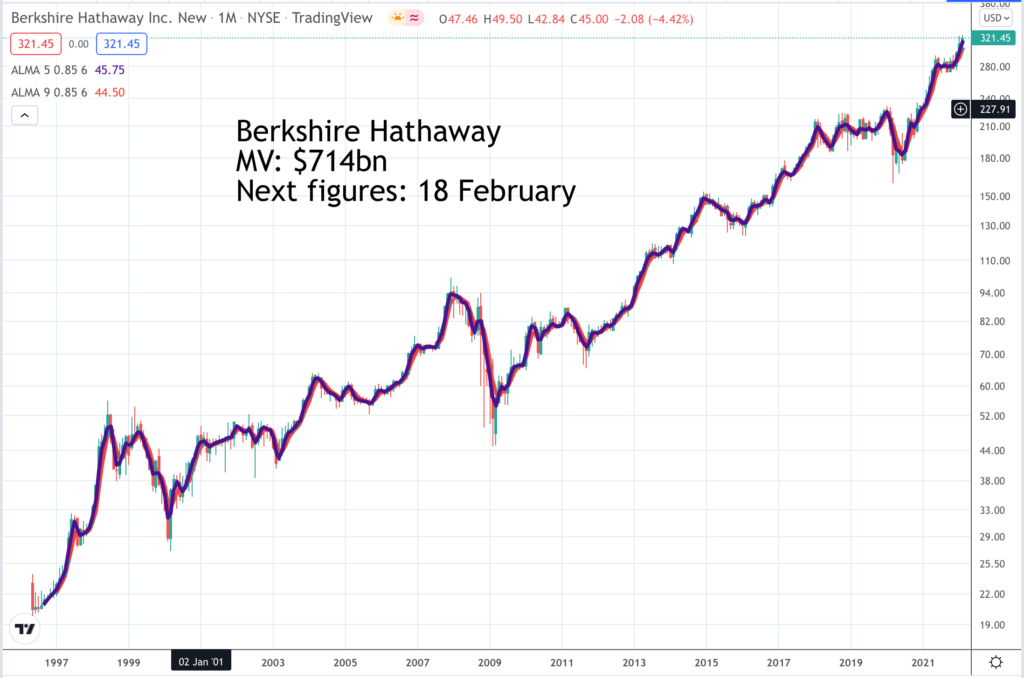
This question of whether to trade or to hold is a big one for investors. We know what Warren Buffett does. He holds through thick and thin and it has worked amazingly well for him. Even now the chart of his master company, Berkshire Hathaway (see below), is holding up well. But it is also true that in any significant downturn many people will look at the charts and either use them to sell or spend quite a long time wishing that they had.
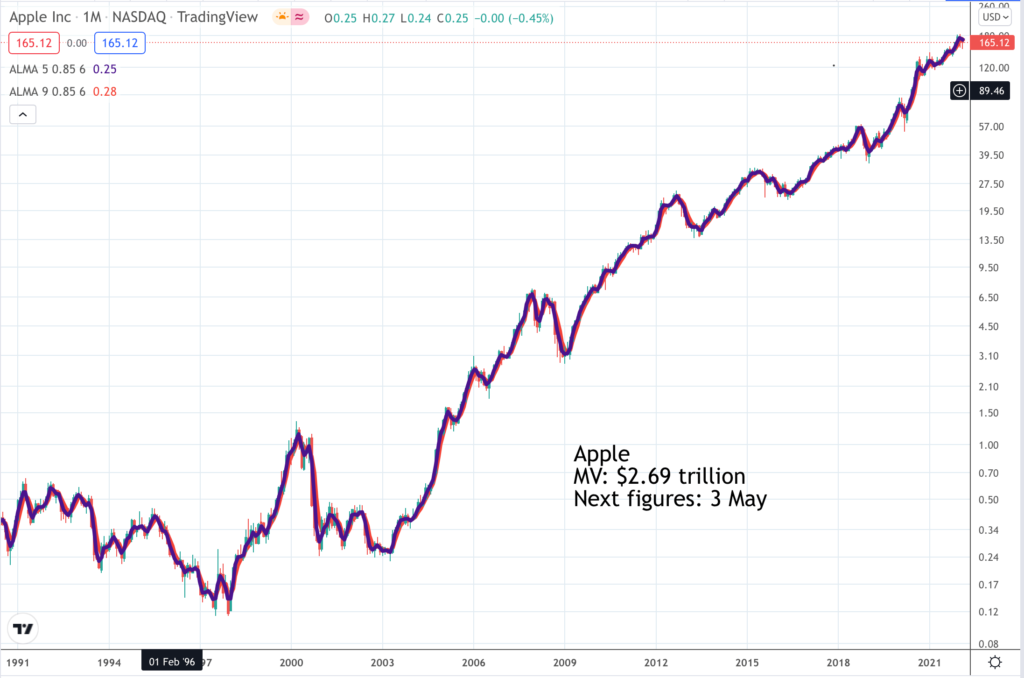
One of Berkshire Hathaway’s biggest holdings is in Apple and their shares too are weathering the storm in style. I would prefer to see a chart buy signal before buying the shares but they have been strong and the news coming from the business is positive. They also have a share buyback programme the size of many countries’ GDPs and that must help. Insurance, which helps Berkshire Hathaway generate much of its cash (insurance premiums are paid ahead of claims) can also be a good place to be when times are tough and interest rates are rising.
Most recently I have been looking at the balance of uptrends to downtrends on my ETF charts. It is almost a slam dunk for negativity with virtually every single ETF I track in a downtrend. I measure these by moving averages. When a shorter term moving average drops below a falling longer term moving average this is known to chartists as a dead cross and signals a downtrend.
The reverse, when a rising shorter term moving average rises through a rising longer term moving average is bullish and is known as a golden cross. There are not many of those around around at the moment but one day there will be.
Incidentally, the market will bottom out when the charts look terrible so just because they all look terrible doesn’t mean it it is time to walk off the beach and never return. It just means we don’t have any (or many) buy signals yet. What is alarming, as happened in December and January, is when we get a lot of sell signals and new downtrends after a prolonged period of rising prices. The deeper we go into the bear in terms of both depth and time the stronger the basis for an eventual recovery.
For someone like me who trades on maxed out five times leverage weakening charts like those I signalled on 6 December are a clear warning that I need to take cover and I do. The plan is always to survive to fight another day. Even now we can start to get a feeling of which shares and companies will weather the carnage best by the ones that are (a) holding up best in share price terms and (b) delivering the exciting fundamentals that we are looking for.
There are many business reporting strong growth, names like Apple, Alphabet, Amazon, Cloudflare, Datadog, Palo Alto Networks, which is doing so well I am showing the chart below, CyberArk Software, ServiceNow, Upstart and many more that don’t spring to mind just now. When I look at the QV for Shares portfolio the recommendations from 2021 have taken a hammering after a string of great years but in fundamental terms they still look like a list of some of the world’s most exciting businesses.
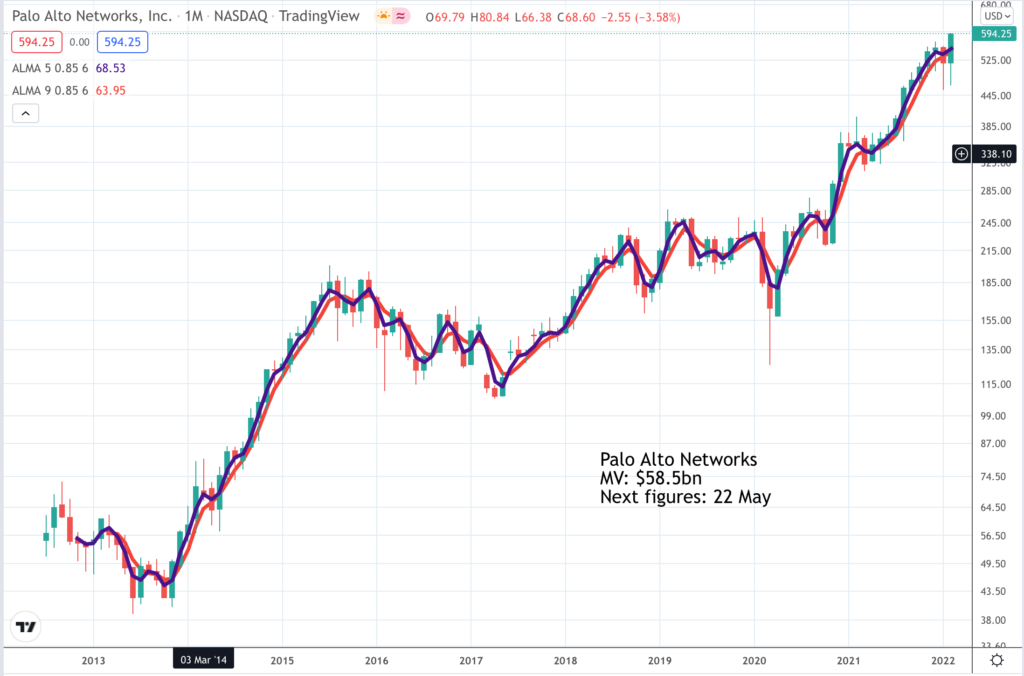
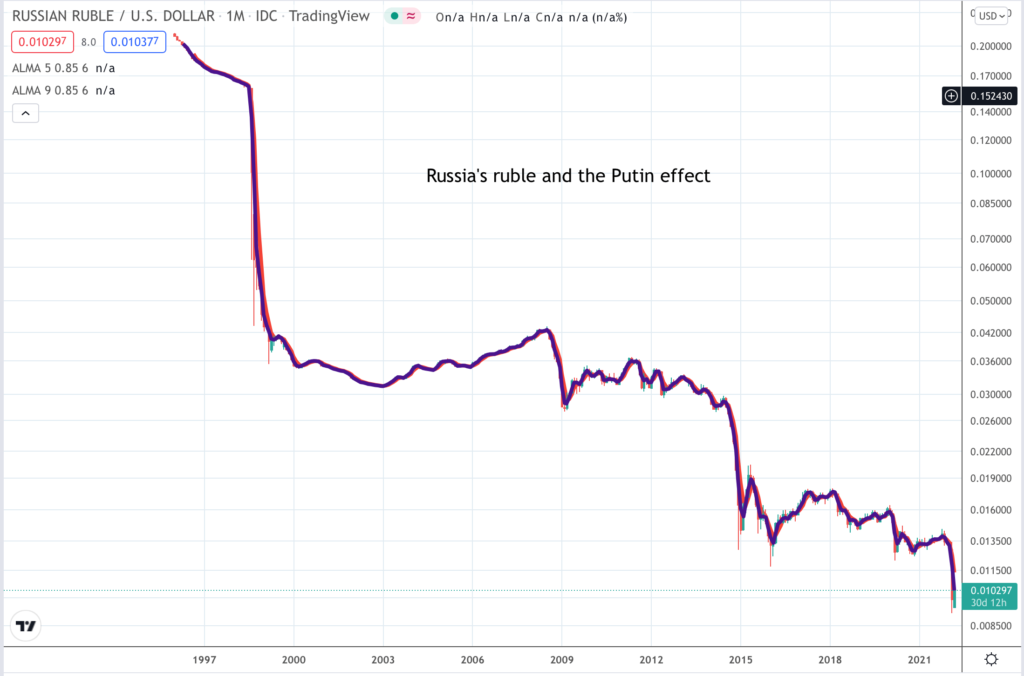
Latest results from Palo Alto Networks were outstanding. Number one the company is on fire. “As you’ve seen by our results we released, we had an exceptional Q2. We continue to accelerate the growth of our business in line with our stated direction of fiscal year ’22 being the year of focused execution.” Number two the trading background is strong and, if anything, getting stronger, no doubt helped by that murderous old grinch in Moscow and his sleazeball colleagues.
“Firstly, we continue to see strong demand for cybersecurity. We have not seen any changes in the IT spending patterns of our customers or a slowdown in companies investing in IT systems through our competitive advantage. On the contrary, we see acceleration around trends associated with the shift to the cloud as well as the continued efforts to redefine network architectures to enable employees to work effectively from anywhere, a trend which has been bolstered by the pandemic, and we continue to believe we are still in the early innings here.
Both these factors underpin continued demand for cybersecurity services. Secondly, we continue to see an evolving and complicated threat landscape. We’ve highlighted in the past that cybersecurity is at the front and centre of all conversations around risks and threats at companies as well as nation-state levels. We believe cybersecurity will continue to become more and more relevant and important.”
Palo Alto Networks is not just a company in the right place at the right time. There is something else going on here. This business was founded in 2005 to help companies with their cyber security. It grew like topsy for a while then seemed to stagnate as other more cloud-aware rivals took centre stage. This is no longer an issue because Palo Alto has been reinvented for the new era of cloud computing.
This is helping it selling more products and win larger customers to its platform.
“With a growing portfolio of products across three platforms, making large deals selling a repeatable process is core to our sustaining and accelerated growth trajectory. With BJ Jenkins taking over the leadership role for our broader sales organization, we’ve had an ability to increase management attention on the largest deals in the form of Amit Singh, our CBO [chief business officer]. We’re pleased with the results we have seen in the first half of the year. These deeper multi-platform relationships are a win-win for Palo Alto Networks and our customers.
As a testament to this, at the end of Q2, 47pc of our Global 2000 customers used products from all three of our platforms, up from 38pc a year ago. In Q2, we closed 221 seven-figure transactions, including three transactions over $20m. Our military customers were 1,077 in Q2, up 26pc year over year. Our combined rate of growth in $1m customers, as well as an increase in size of our large deals, has helped us sustain the accelerated level of growth you’ve seen over the last several quarters.”
Very unusually in this market the Palo Alto chart shows a clear breakout. It will probably be volatile but should head higher over time. One analyst had this to say about the company.
“Adding in elevated level of threats, the enterprise driven shift to the cloud and possible Russian cyber attacks, Palo Alto is likely to see a “parabolic growth cycle” in 2022.
We believe this is a cloud cyber security re-rating story in motion and view Palo Alto’s stock as having a strong upward trajectory despite overall market jitters over the next year as the Street starts to fully appreciate the cloud transformation playing out under the hood.” This analyst’s target for the shares is $630.
Looking at the balance of shares in uptrends to those in downtrends proved helpful in generating a sell signal before the worst of the sell-off. There is another indicator that can be useful in spotting the turn close to the bottom of the market. This is the Coppock indicator. Invented between the wars by a man called Coppock in America it was adopted by Harold Wincott, a former editor of The Investor’s Chronicle and then, revived by me many years later, when I was writing about charts for that magazine.
Coppock is amazing at identifying important stock market low points. It is a measure of weighted momentum which makes it sensitive to changes in momentum. Coppock always said it was not much use for generating sell signals because money flows mean the stock market spends most of the time going up. Falls are against the long-term trend so when the fall loses momentum thus causing the Coppock chart to turn higher this can be a great time for buyers to strike.
As usual in the computer era we can generate Coppock indicators for everything and indeed millions of indicators for everything so it is easy to drown in the noise. I am working with my cousin to try to avoid doing that and making sure we keep what is valuable about Coppock.
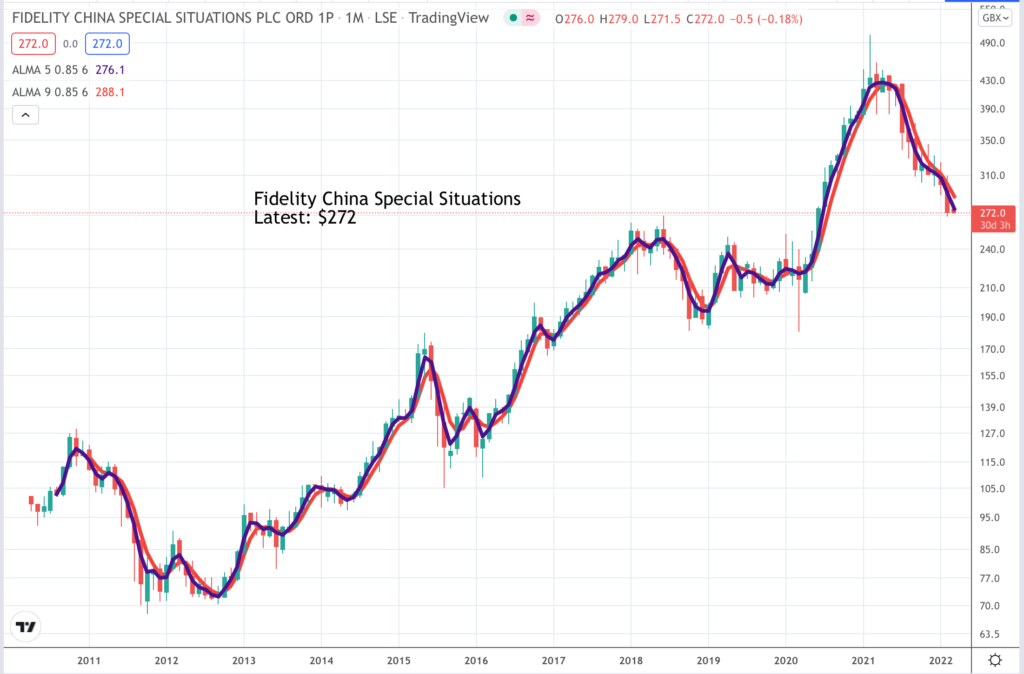
The basic theory says that a buy signal is important if it occurs after the indicator has become negative. As an example Chinese technology shares quoted on Nasdaq and in Hong Kong have been falling heavily for months and a Coppock indicator for an ETF, Fidelity China Special Situations (charted below), capturing some of this performance has turned negative. After reaching +160 in April 2021 the latest reading is -40. When this indicator turns higher it will be important and hopefully around the same time we may be seeing buy signals for individual Chinese shares.
Incidentally another indicator I use in tandem with the moving averages is trend lines. A change of direction by the moving averages often coincides with or closely follows a trend line break. A buy signal is given when a downtrend line is broken and vice versa. You can see on the chart below where trend lines would have been broken if they were drawn and we are in a clear downtrend presently.
Another point about Coppock is that as far as I know nobody has had much success using the indicator with individual shares (I make an exception for ETFs which are collections of shares). The idea is that they work only for buy signals and only with indices. I have been looking at QQQ3, which is like the Nasdaq 100 on steroids, moving in the same direction as the index but much more dramatically. The chart is shown below.
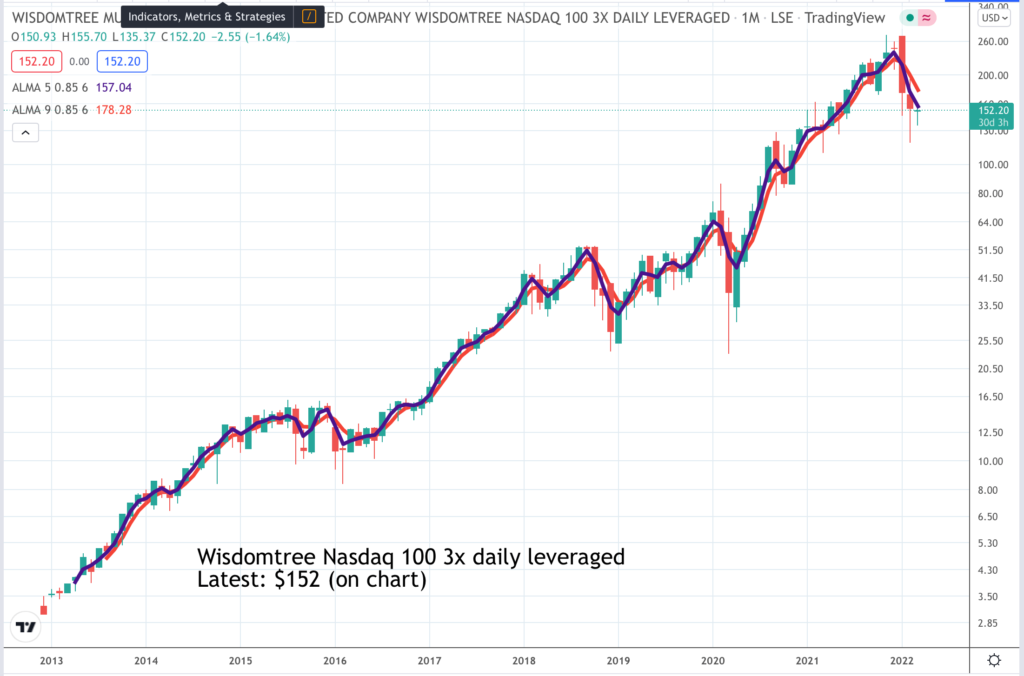
It would be exciting if Coppock worked for this ETF and so far it looks very much as though it might. We have had two great buy signals and now the conditions are falling into place for a third. The Coppock indicator peaked in August 2021 with the ETF around $220. The ETF climbed further to peak around $275 but is currently $152, having been as low as $118. The indicator is falling fast and is down from 336 to 146 so not yet negative but absent a strong rally it will be dropping some big numbers out so we may well see a move into or close to negative territory. My hunch is that the next buy signal will be important.
I always add that ETFs like QQQ3 are special cases because most likely they are always right to buy. This is an ETF tracking everything that is best about corporate America. It seems overwhelmingly likely that it will always recover to new peaks so if you just keep buying, say every month, that should do well too. Or you could just buy a few every time the stock market plummets. It is a classic win in the end investment and the wins can be huge. Trough to peak since this fund was launched in December 2012 the ETF has climbed over 90 times. How many shares can match that performance!
Helped by my cousin I am learning that there are hidden risks with leveraged ETFs. This is what one of the main managers, Direxion, says about their leveraged ETFs.
“As nice as it is to see greater than expected returns, you must understand that these compounded returns will increase (for a Bull ETF) your exposure levels, and possibly an outsized return greater than the 3X level, making your position more sensitive to future market movements. Consider selling your excess gains and managing to a specific exposure level.“
I think this is excellent advice so with leveraged ETFs I am going to investigate specifically incorporating a selling strategy based on charts and Coppock.
It turns out that leveraged ETFs outperform the underlying indices over periods longer than one day in periods of sustained strength but can underperform in periods of volatility. This is what they say.
“These leveraged ETFs seek a return that is +300pc or -300pc of the return of their benchmark index for a single day. The funds should not be expected to provide three times or negative three times the return of the benchmark’s cumulative return for periods greater than one day.
In pursuit of their daily investment objectives, leveraged ETFs must rebalance their assets to exposure ratio on a daily basis. This means that their returns over time are the product of a series of daily returns, and not the ETF’s beta multiplied by the cumulative return of the index for periods greater than a day.
This deviation in performance is commonly referred to as compounding. The example above illustrates that high volatility causes decay of long-term returns for the ETFs, while sustained market trends can result in positive effects on returns.”
Yet again this reinforces the message that we need a strategy for selling as well as buying with these particular ETFs. Fortunately we can lose a lot of our gains and still do very well. It turns out that the key question now is will the overall stock market resume its sustained uptrend since 2009 or will it become more volatile.
Here is a final warning that my cousin found on one web site.
“As an extreme example it is possible for an investor to lose all of their money in a three times leveraged ETF if the underlying index moves more than 33pc on a given trading day.”
As far as my cousin and I can tell this has never happened?
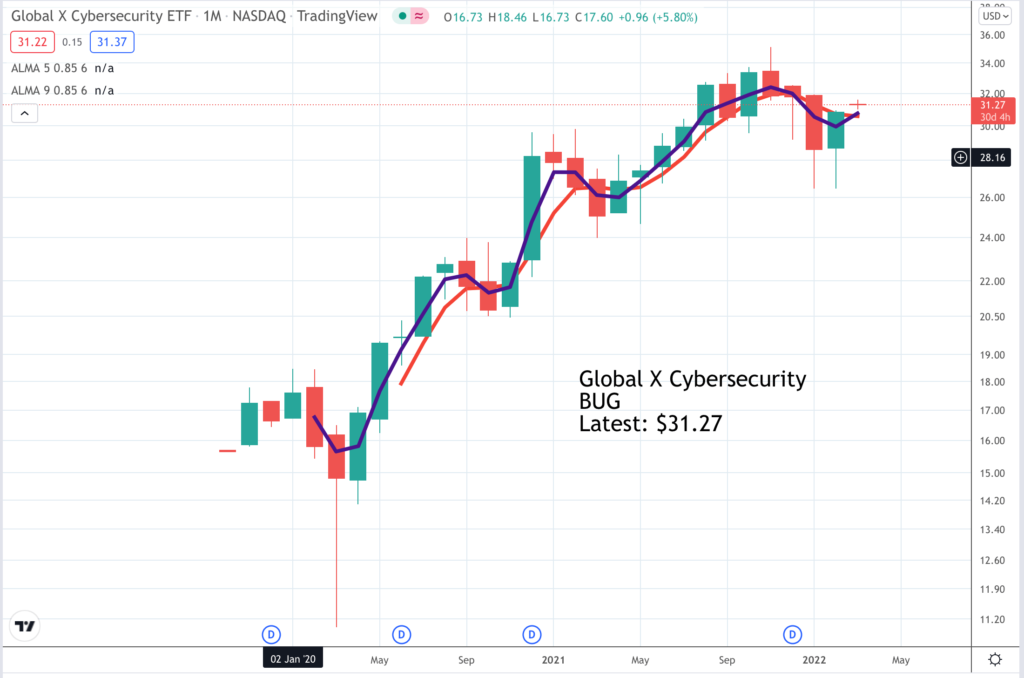
An encouraging factor for my Palo Alto Networks recommendation is early signs of a buy signal for a cyber-security ETF called BUG where Palo Alto Networks is the second largest holding. The chart is shown below.
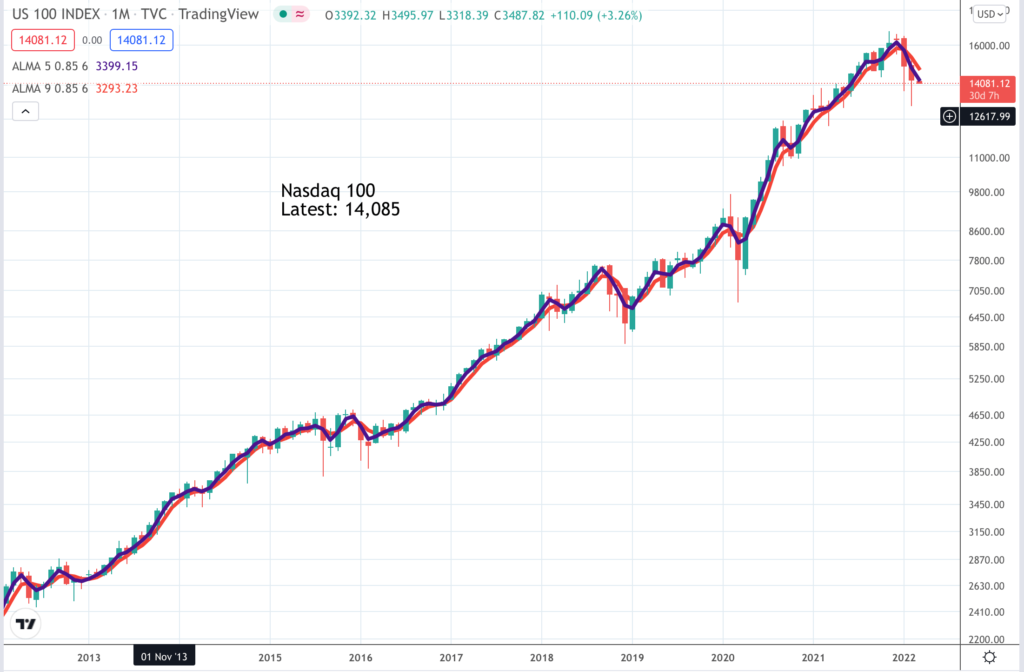
However the truth is that the general chart background is cautionary. Below is a chart of probably the world’s most important index, the Nasdaq 100. It does not look good. The recent uptrend line has been decisively broken and the moving averages are falling in classic bearish formation. The Coppock indicator has been falling since May 2021 but is not yet negative. A buy signal would be given when the shorter moving average (blue) turns up through the longer moving average (red). Ideally both should be climbing in tandem. A Coppock buy signal would be generated by the indicator turning higher, ideally from a negative position.
It is very hard for western observers to figure out what is going on with Putin hence the widespread speculation that he may be mad. Mad or bad; he is certainly something nasty. There seems to be little advantage to Russia in restoring a deeply disaffected Ukraine as a part of the Russian empire. At the same time there are considerable costs in terms of sanctions and international opprobrium. Even the hatchet men leading China are keeping their distance. There must be a possibility that a Putin long isolated by paranoid fears of Covid may have overreached himself in a move which could end with his downfall. We live in hope.
it is not clear that wars are necessarily bad for stock markets. The Germans have already announced the creation of a staggering 100bn euro fund for military spending so as well as spending more to fight off the Russians we are going to have to watch out for them as well (just kidding). There is also going to be major infrastructure investment to lessen our dependence on Russian energy.
The key point to remember is Buffett’s mantra. Believe in your fellow men and their ingenuity and energy and that will always make you an optimist and a long-term bull of stock markets.
Shares recommended in this issue
Palo Alto Networks. PANW Buy @ $ 576