Using buy signals to make investment decisions
Last night I watched a documentary on BBC iPlayer about the 1918-19 Spanish flu pandemic, which may have killed between 50m and 100m people. Like Covid-19 it killed people by attacking the lungs. People drowned in their own blood. It reinforced my feeling that I do not want to catch this thing. It also made scary viewing because the flu came in 1918, killed, went away and then came back again, in 1919, more deadly than ever. Health services were totally overwhelmed and couldn’t do much anyhow. Care was mostly palliative.
We have obviously learned a great deal since 1918; back then they didn’t really know about viruses and thought the flu was caused by a bacterium. They were sitting ducks, which is ironic since one possible source of the flu was wild ducks infecting farmed animals and then passing on to humans.
The deadly second round may have come about as the virus adapted to being in humans. We are better placed to fight the pandemic in 2020 but it has still been spreading with terrifying speed and even if we do get it under control the jury is out on how quickly normal service can be resumed in the global economy.
Buy signals
As far as I know Warren Buffett does not use buy signals to take investment decisions. Buy signals are usually chart-based and he always presents his arguments with a mixture of fundamentals and common sense. Nevertheless I do sometimes wonder. One of his greatest triumphs was to invest in Coca-Cola back in 1982. At the time the company was making a historic shift from being a giant global manufacturing and bottling operation to being an intellectual property company. They sold and floated all the bottling plants and just kept the formula and earned royalties. In effect, they turned themselves into Microsoft.
This did wonders for the share price and proved a great moment to buy the shares. Something else also happened to Coca-Cola in 1982. The shares gave a spectacular chart buy signal by moving up out of a multi-year pattern of sideways trading. Was Buffett influenced by this? I have no idea but it has always been a possibility. Something new on the fundamentals plus a dramatic chart buy signal creates a super exciting buying opportunity.
Sadly, these things are easier to spot with 20:20 hindsight. The trick is to try to identify them at the time when there is always so much noise from all the conflicting things that are happening.
Being on board for the rise
One of my ideas about stocks and even stock markets is that they have their day in the sun. Microsoft had an incredible day in the sun in the 1980s and 1990s. Unusually, it seems to be having another day in the sun period right now. The latest one, which is very much related to a new CEO, Satya Nadella, and his focus on cloud computing, began in November 2013, with a breakout from a prolonged period of sideways trading. The best way to profit from these long uptrends is to do like Bill Gates, hold the shares for the long term. Fortunately for him, he didn’t have much choice about this. For the rest of us Microsoft is just one of 100,000 quoted shares around the world. It is easy to (a) get distracted and (b) get nervous and take profits, when pundits tell us the shares are overpriced as they did with Microsoft for the entire period between 1980 and 2000.
It is amazing how often the wise and the good turn out to be really dumb and there can be few things more lethal than an ‘expert’, when something new and unexpected is happening. Common sense is always your greatest friend in almost any situation, including the stock market.
Buy signal investing
One way to avoid some of this nervousness is to use buy signals to invest. You find a great stock, which in recent years has included Amazon, Alphabet, Microsoft and Netflix. You have three options. You can buy and hold, which will be the best strategy if you are right about the stock. You can buy a small stake and add more on successive buy signals. This is a more cautious approach and if you do it across a portfolio of stocks it will focus your resources on the best performers.
Most safety-first of all is to buy on buy signals and step aside on sell signals. This will protect your capital especially from shares in companies, which flatter to deceive. These are the ones that rise strongly, sometimes for years and then lose the plot completely and collapse. The problem with this approach is that it requires enormous discipline and you may make some unnecessary and costly sales, where you end up buying back in at a higher price.
Last of all you can not follow the signals religiously but use them to inform your decisions in a more general way.
What is a buy signal?
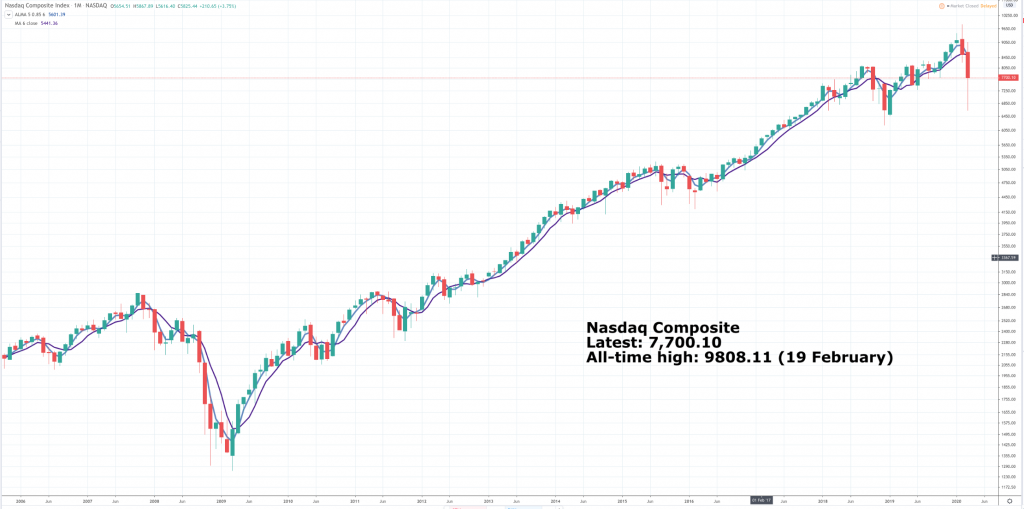
It is whatever you choose to make it. I use three things – pattern analysis, trend lines and moving averages. We can see how these work in action with the Nasdaq Composite chart.
First, pattern analysis – in March 2013, the index punched up to its highest level for 13 years. In doing that it confirmed all those 13 years of trading as a pattern, a massive consolidation from which it had broken higher. What I call a chart breakout. This proved a great time to buy US shares. Since that buy signal US shares are up two and a half times, having trebled at the recent peak.
Trend lines I tend to use in conjunction with the moving averages. A good example came in March 2014. The index consolidated enough for my shorter momentum-weighted moving average to turn down and touch the still-rising longer-term moving average. When the shorter moving average turned higher again this was a great buy signal.You could also draw a trend line connecting the monthly peaks during the consolidation period. When this was broken that gave a buy signal. The two things happened more or less together.
Strategy two would be to buy more US shares every time these techniques gave a buy signal. Since 2003 there have been some 15 such buy signals, so roughly one a year and buying every time would have delivered a very good result. You don’t need to be a genius to spot these signals. Another of my rules is that if they are not obvious they are not happening.
The problem with trying to use the same tools to generate sell signals is that you will sometimes sell unnecessarily, what chartists call being whiplashed. This happened in 2015, when you could have sold, bought, sold and bought again in a market going sideways. You would have made losses in this period but thereafter prices rose strongly again.
Most people would be doing this with individual stocks rather than the index and there moves can be bigger, which helps the strategy. As always the key is stock selection. If you pick a stock with 3G characteristics (great story, great growth, great chart) then most approaches should work well over time.
Sell signals
Different moving averages produce different results but using my techniques the latest thing we have for the Nasdaq Composite index is a sell signal. Both moving averages are declining but the fall has been so swift that they haven’t actually crossed yet to create what chartists call a ‘dead cross, the classic signal of a bear phase.
This is where trend lines can help. A trend line starting with the December 2018 low point and roughly connecting subsequent reaction lows has been decisively broken, when the index was around 8,500.
Since then the index has become massively oversold and staged a strong rally. At this stage we would have to call this a rally in a bear market so investors will remain understandably wary. On the fundamental side the virus story is still playing out, albeit with some hopeful signs, while the economic impact has barely begun. The only thing we know is that it is likely to be dramatic given the huge demand shock from widespread lockdowns.
This is where the buy signal strategy comes to the fore as a safety first way of dealing with an uncertain world. Once a sell signal is in place, arguably from the moment trend lines are broken and the shorter moving average turns down, caution should be the watchword.
What applies to the index applies to individual stocks. Alphabet has given a clear sell signal, with both my moving averages declining and having crossed for a ‘dead cross’. Trend line analysis pinpointed the sell signal at around $1325. This analysis doesn’t tell us how far the shares might fall or whether the recent low around $1000 was the bear market low. What it does say though is that the shares are vulnerable. Most probably for long term investors the shares are a buy. Alphabet is a great company and any hit to ad revenue from the global demand shock is likely to be short-lived. If you want to play it safe you can do this by waiting for a buy signal; that is how to use buy signals to take investment decisions.
Many shares are now in bear trends with falling moving averages. The whole market too so this approach makes the case for waiting. Don’t shoot, you might say, until you see the whites of their eyes.
Technology shares to outperform
Meanwhile I stick to my broad thesis that the stay-home economy will be yet another reason for us to want ever better technology and thus that technology shares as a group will dramatically outperform the rest of the stock market, much as they have been doing for years now. They will fall less and recover faster.
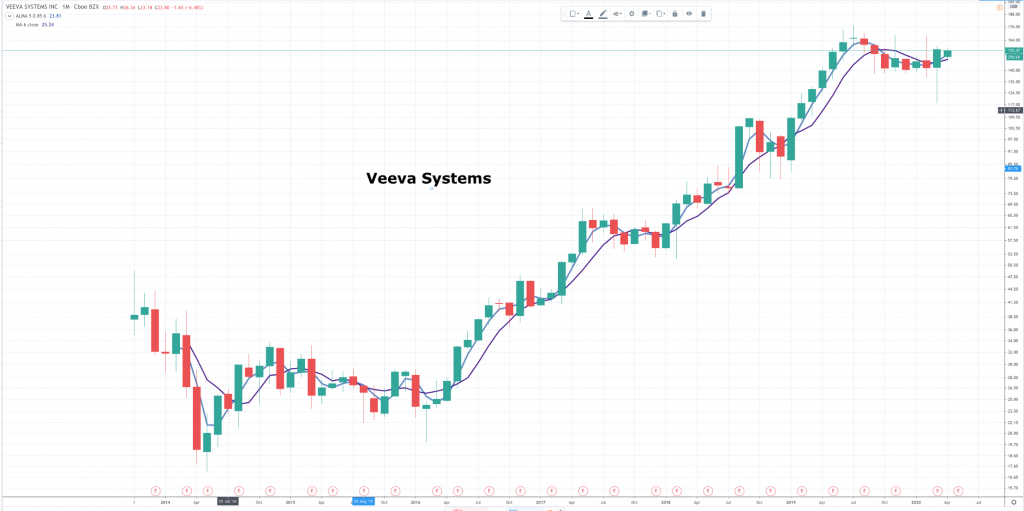
Veeva Systems VEEV Latest: $155 MV: $23.1bn Year-end: 31 January Next figures due: 28 May
On the subject of buy signals my system has just given a buy signal for Veeva Systems, which is being alerted for the fourth time.
Veeva is a leading global provider of industry-specific, cloud-based software solutions for the life sciences industry. Their solutions enable pharmaceutical and other life sciences companies to realise the benefits of modern cloud-based architectures and mobile applications for their most critical business functions, without compromising industry-specific functionality or regulatory compliance.
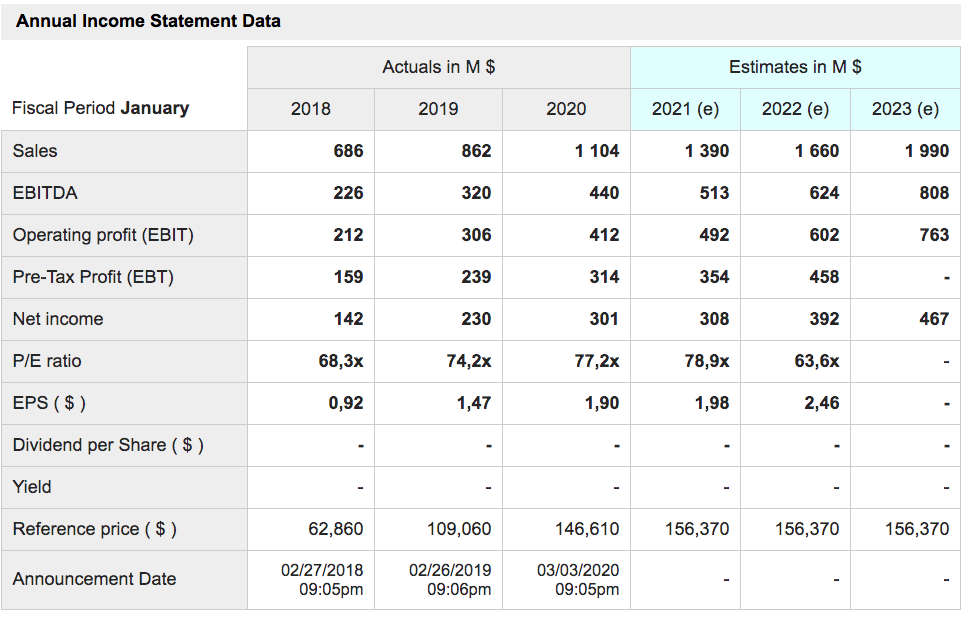
As well as a good story it has a record of strong growth. The table below shows the recent history plus analysts’ expectations for the future. Typically these expectations won’t have been adjusted for the impact of the virus on the global economy but in the case of Veeva that could easily be positive.
In a very recent interview, CEO and founder, Peter Gassner, noted:
“Veeva’s customers have risen to the challenge of Covid-19 and are hard at work on testing, treatment and prevention measures to combat the virus. Veeva’s technologies are helping to connect doctors to pharma reps virtually. After achieving $1bn in annual revenues ahead of schedule Veeva is targeting $3bn in revenue by 2025.”
This is what Gassner said about the Q4 2020 (note 31 January year end) results”
“Q4 was another strong quarter with results ahead of our guidance. Fourth quarter revenue was $312m, up 34pc year-over-year, subscription revenue grew 33pc and our non-GAAP operating margin was 34pc. Past year was an exceptional one for Veeva. We retained our deep focus on customer success and product excellence. We expanded our leadership position and passed $1bn in revenue a year and a half ahead of plan…… In all, we have set ourselves up well from a product, operating model and team perspective to execute on the major opportunities ahead and to achieve our $3bn revenue target in 2025….. We have a big opportunity ahead and the right team, operating model, technology and focus on execution to fuel our growth well into the future.”
The shares look timely to buy.

| These are testing times. It is not surprising that after a dramatic rally investors remain cautious as they consider a pandemic that is still spreading rapidly in most locations and to which the only response is an economic shut down. It is going to be a massive shock, with many businesses fighting for survival as demand disappears. Even technology shares will not come through unscathed but the long-term story for many companies in this sector looks stronger than ever. |