This is a chart of QQQ3 (that old favourite) plotted with candlesticks, each one of which represents six months of trading. It is negative at the moment but by the time we knew that the index had already fallen a long way. Where these ultra long periodicity charts can be very useful is spotting breakouts from important consolidations.
In 10 years I have marked two of these on the chart but it is a safe bet that if this stock had existed earlier in the millennium we would have another big breakout before the initial period of rising prices. These breakouts represent big opportunities and typically come against the background of rising Coppock indices.
Just to remind you the blue vertical line in 2023 represents my best current guess of when the presently falling Coppock indicator is going to give a buy signal.
The message is that a combination of a rising Coppock and a breakout from a prolonged period of consolidation is a licence to print money. This is something we need to remember, especially because something similar can happen with individual stocks. Below is a chart of Amazon using 6m candlesticks. On the chart I have drawn the trend lines from which we get chart breakouts. There are four in all. I have also drawn in Coppock buy signals based on a chart with 1m candlesticks. We can see that there is plenty of overlap.
Coppock also gave an early warning buy signal in the July 2001 quarter. Again these long term charts are not terribly useful for sell signals because they turn down so late. This means there is an asymmetry. We can use ultra long periodicity charts (three months or more) for buy signals but need shorter periodicity charts (one month) for sell signals.

Here is another chart that works very well using these techniques.
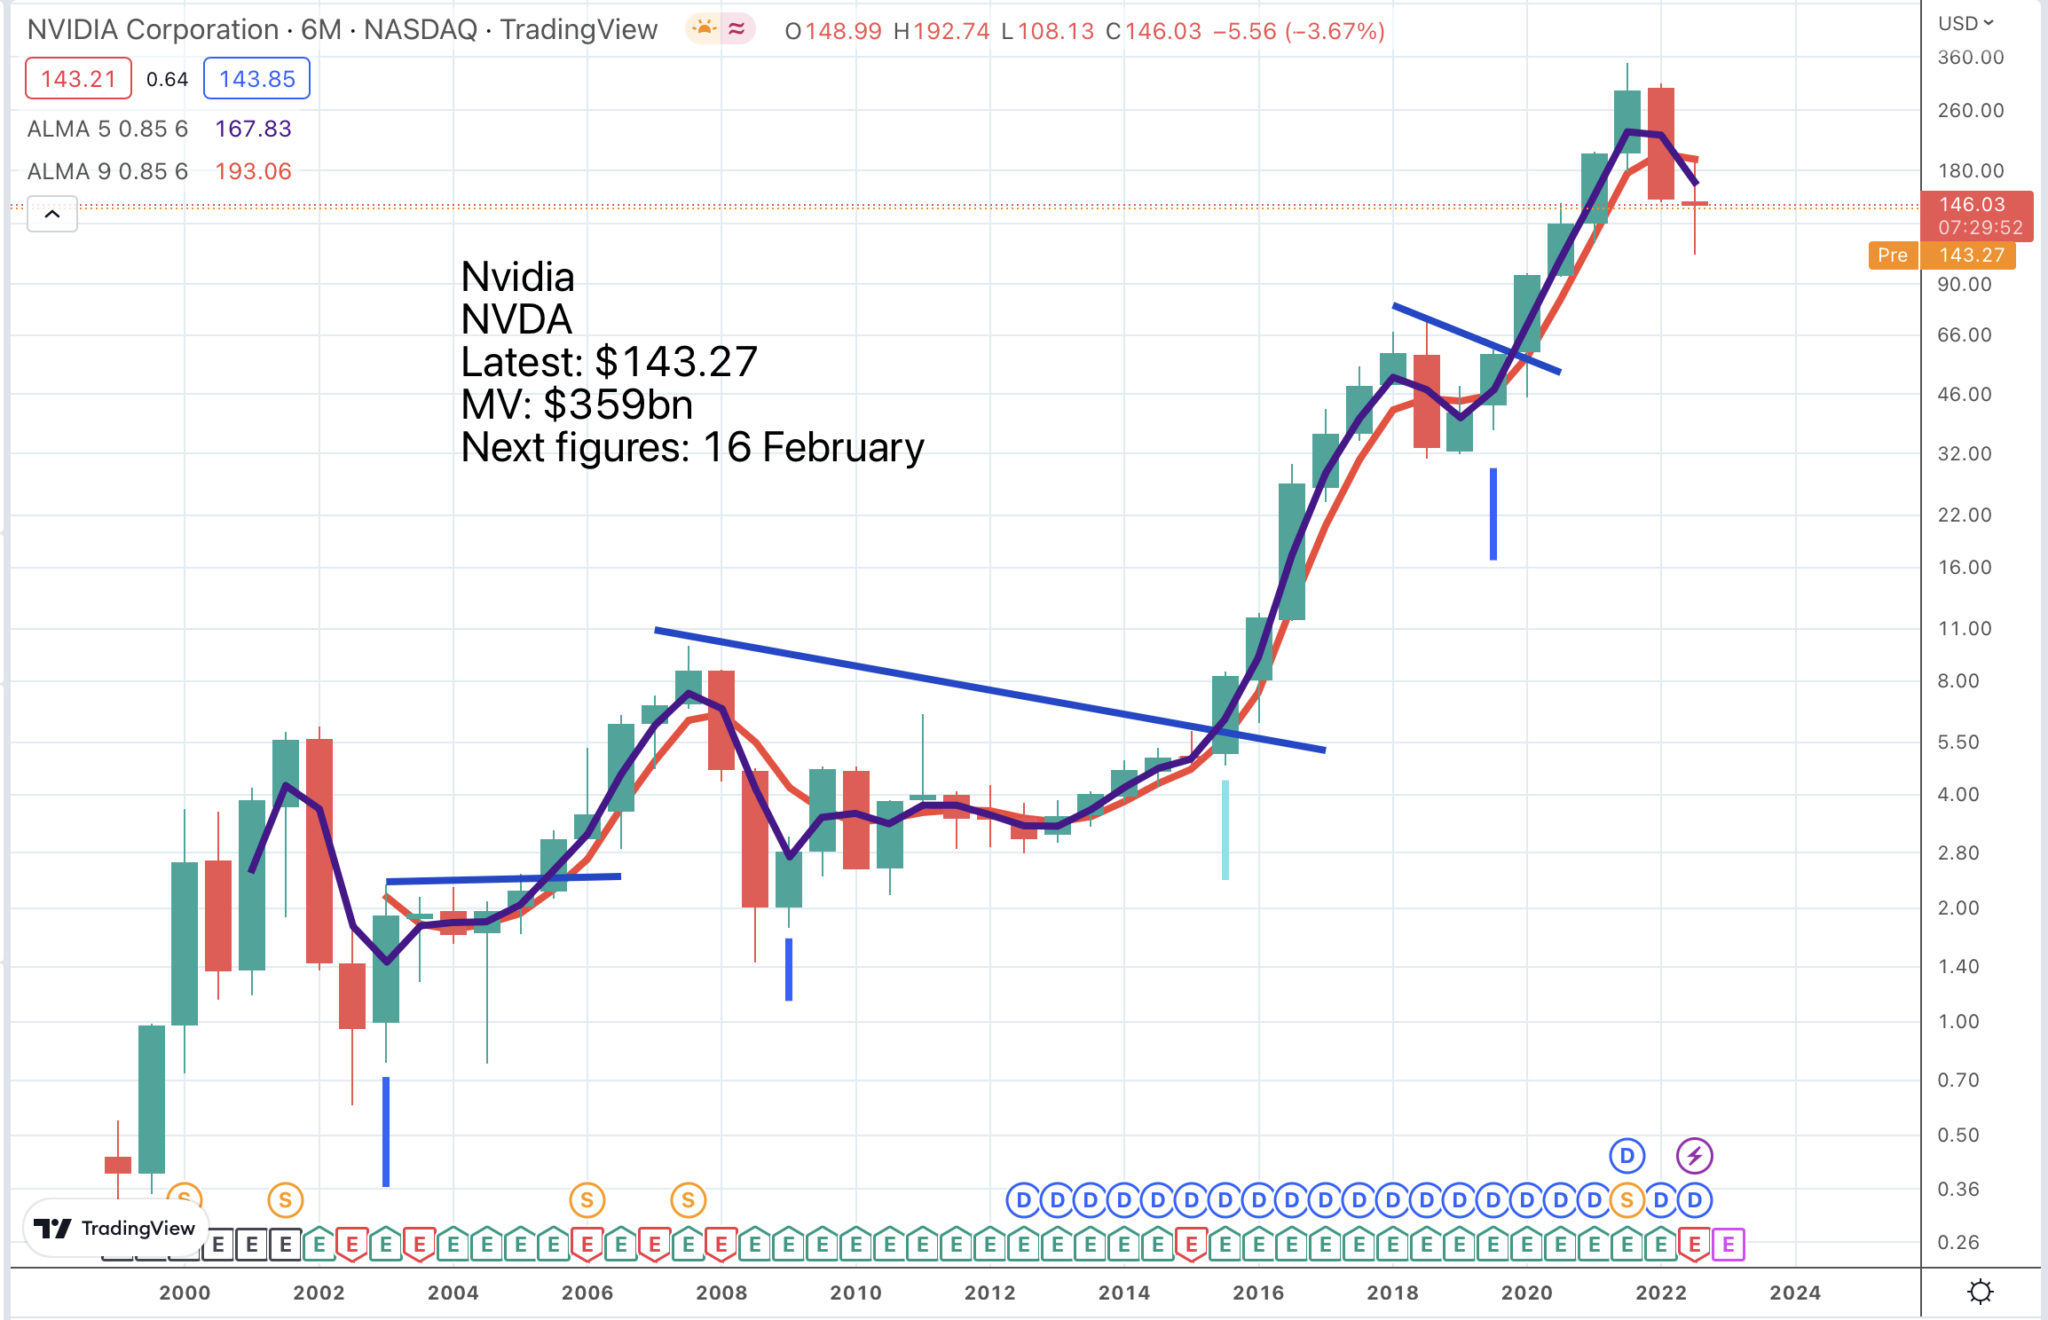
This is not just the wisdom of hindsight that I am using here. I became very bullish of Nvidia after the massive chart breakout in the July 2015 quarter and made lots of money from buying the shares. This was before I had realised that Coppock could be used with individual shares and before I had fully refined my buy and hold/ sell and stay out strategy.
Nvidia was a no-brainer buy in October 2015
What is beautiful about these ultra long periodicity charts is how they highlight the really big breakouts. Add that to the fundamentals, Nvidia is arguably the world’s most exciting semiconductor business so its products stand at the heart of the technology revolution, and it quickly becomes a no-brainer to buy the shares on a breakout.
That is why I love bull markets. You can make so much money just by observing and acting. Many investors worry if the signals are too obvious and cannot believe that they will work but they do. I love obvious. You just need to believe in it and act on it. Most investors overthink it and miss the obvious.
Let’s have a look at Alphabet/ Google on the same basis.

Again the buy signals are clear even without marking in the Coppock buy signals. There is nothing on this chart telling you to buy the shares at the moment. On the contrary this chart suggests that we are in the biggest bear market since 2008.
Yet another stock which tells us how powerful these charting techniques are is Shopify. I have also marked on the chart because it is so clear, a trend line break sell signal. In January 2022 we had a triple indicator sell signal for Shopify based on a monthly chart, when the shares traded as high as $138, which becomes a quadruple indicator sell signal if we include this one from the 6m candlestick chart, which came a bit lower down between $130 and $120.
Shopify gave a clear chart sell signal at four times the current price
The charts gave a clear sell signal at four times the current price. Why did so many investors not act on those sell signals? Because of the fundamental illusion. When the charts said sell the fundamentals were so exciting and the shares had previously done so well they just wanted to hang on in there; that is why we have to learn that when the chart message is clear we act on it. It is hard but doable.
This happens on the buy side too. In the chart of Nvidia above when Nvidia made that huge breakout in October 2015 all the analysts were negative. Their argument was that semiconductors are a cyclical business and that Nvidia shares were discounting the peak of the cycle. The chart message was different and the chart was right.You just have to believe.
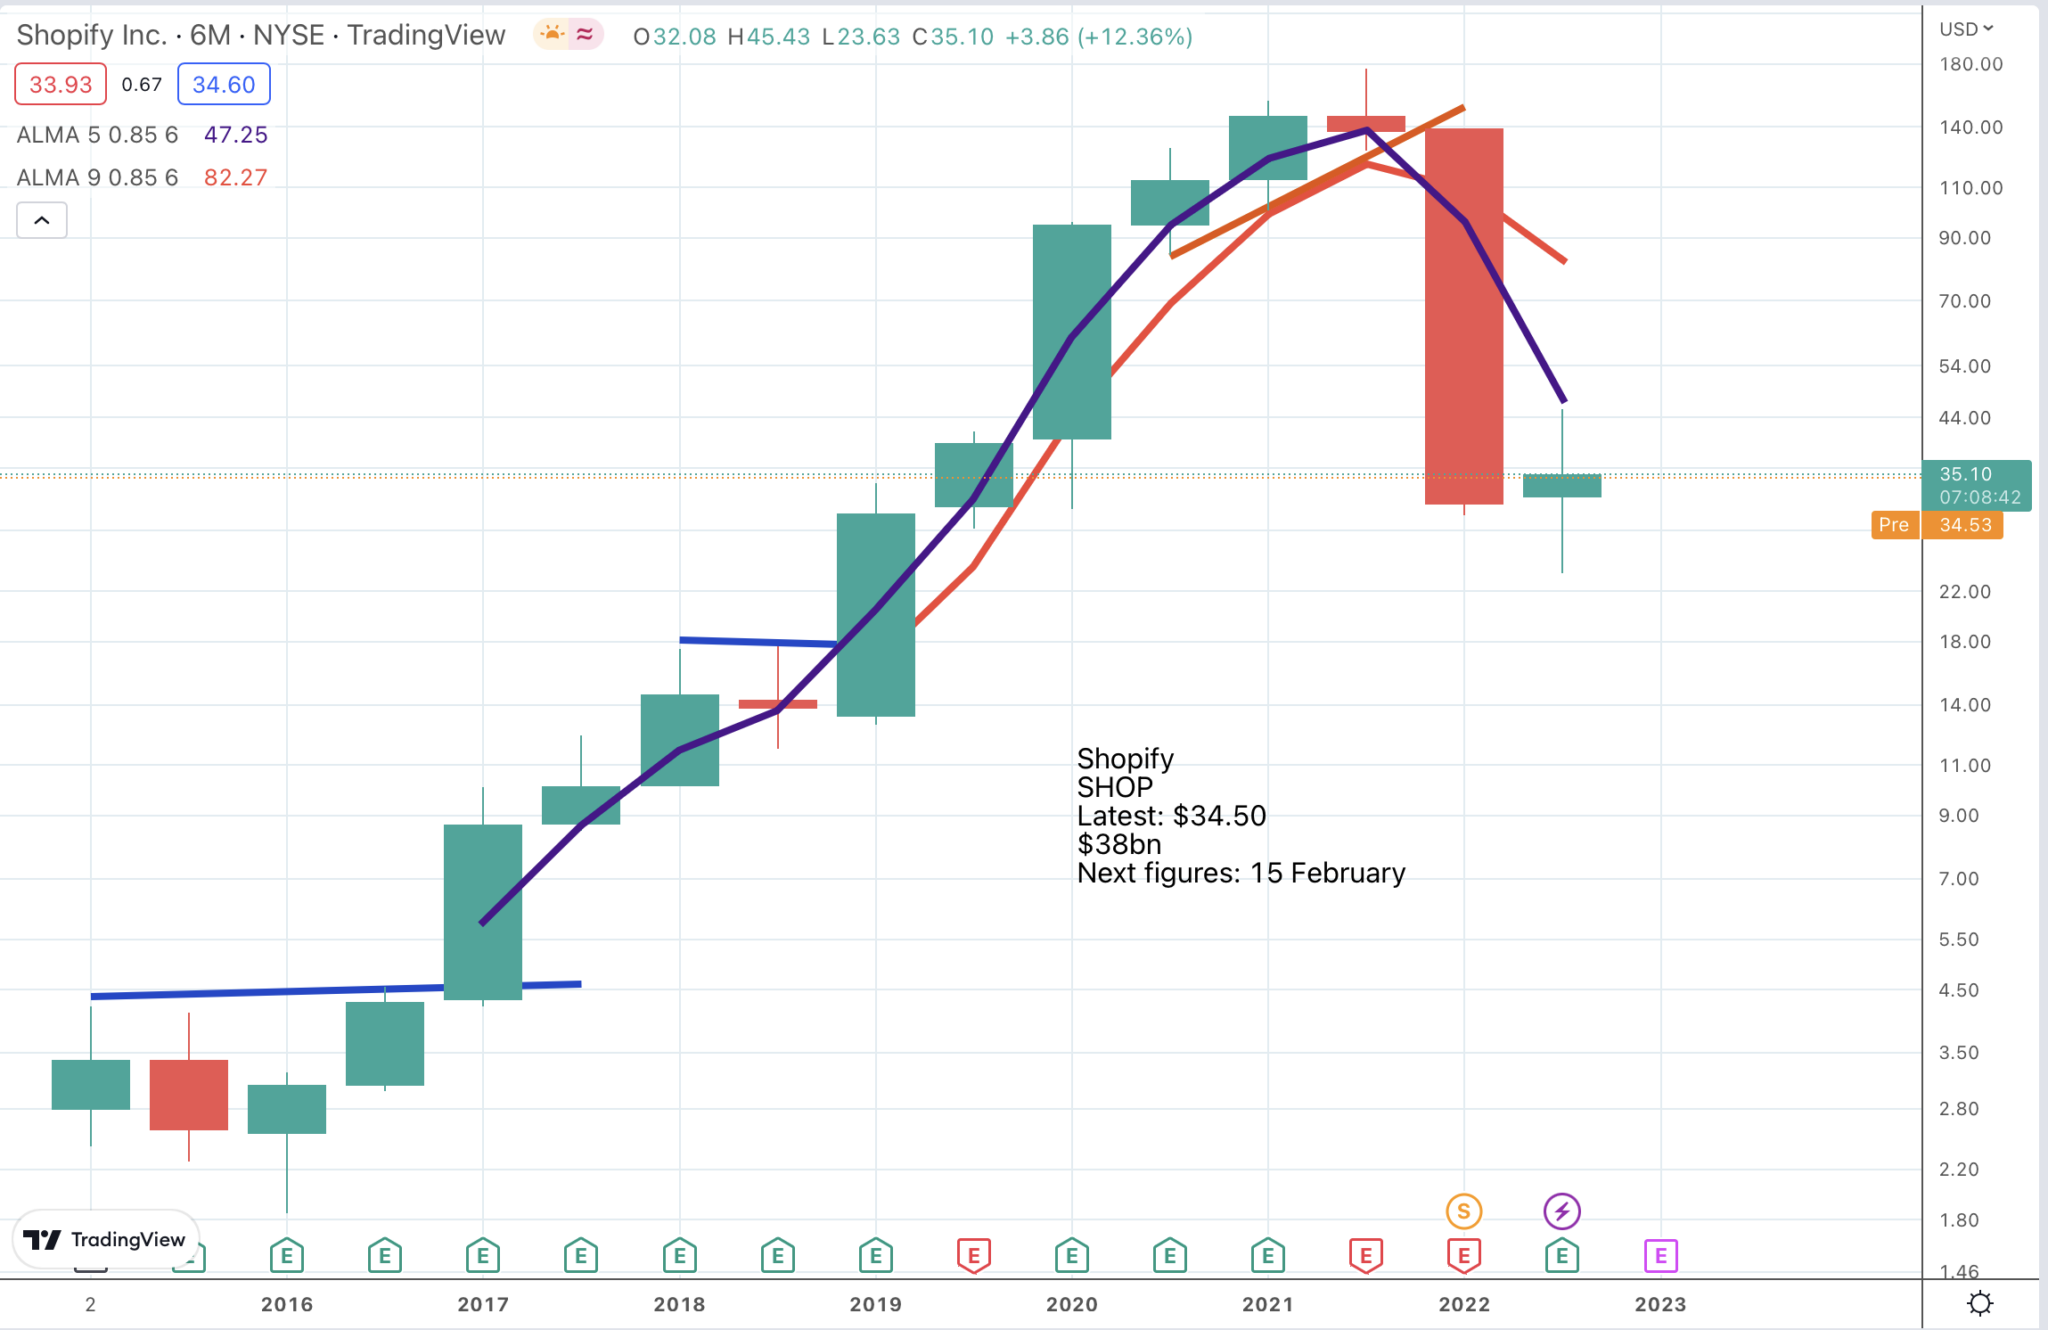
Back to the Shopify sell. signals – all this technical weakness is taking place against the background of continuing exciting fundamentals at the business.
Shopify said Tuesday that the Black Friday and Cyber Monday weekend set a new sales record this year as consumer spending increased across several countries. The e-commerce platform reported sales of $7.5bn during the period from independent businesses globally, up 19pc from a year earlier, led by apparel and accessories. Shopify said more than 52 million consumers bought from brands on its platform, up 18pc over 2021.
29 November 2022
These strong fundamentals encourage me to think that Shopify shares may be building a base but we don’t have any strong buy signals yet and the general stock market background is one for serious hereby-jeebies.
Yet another of the mega caps, Microsoft, has given some wonderful buy signals on the 6m candlestick charts.

These breakouts are exactly what they look like, wonderful opportunities to make money. We knew Microsoft had great fundamentals, providing the operating and applications software for the desktop revolution in the 1980s and 1990s. In the last decade under a new CEO, the company has pivoted with great success to new areas such as the cloud (a subscriptions model for its software and a cloud services business for its huge enterprise client base). This inspired the spectacular chart breakout in January 2013. Trough to peak the shares climbed 10-fold after that breakout.
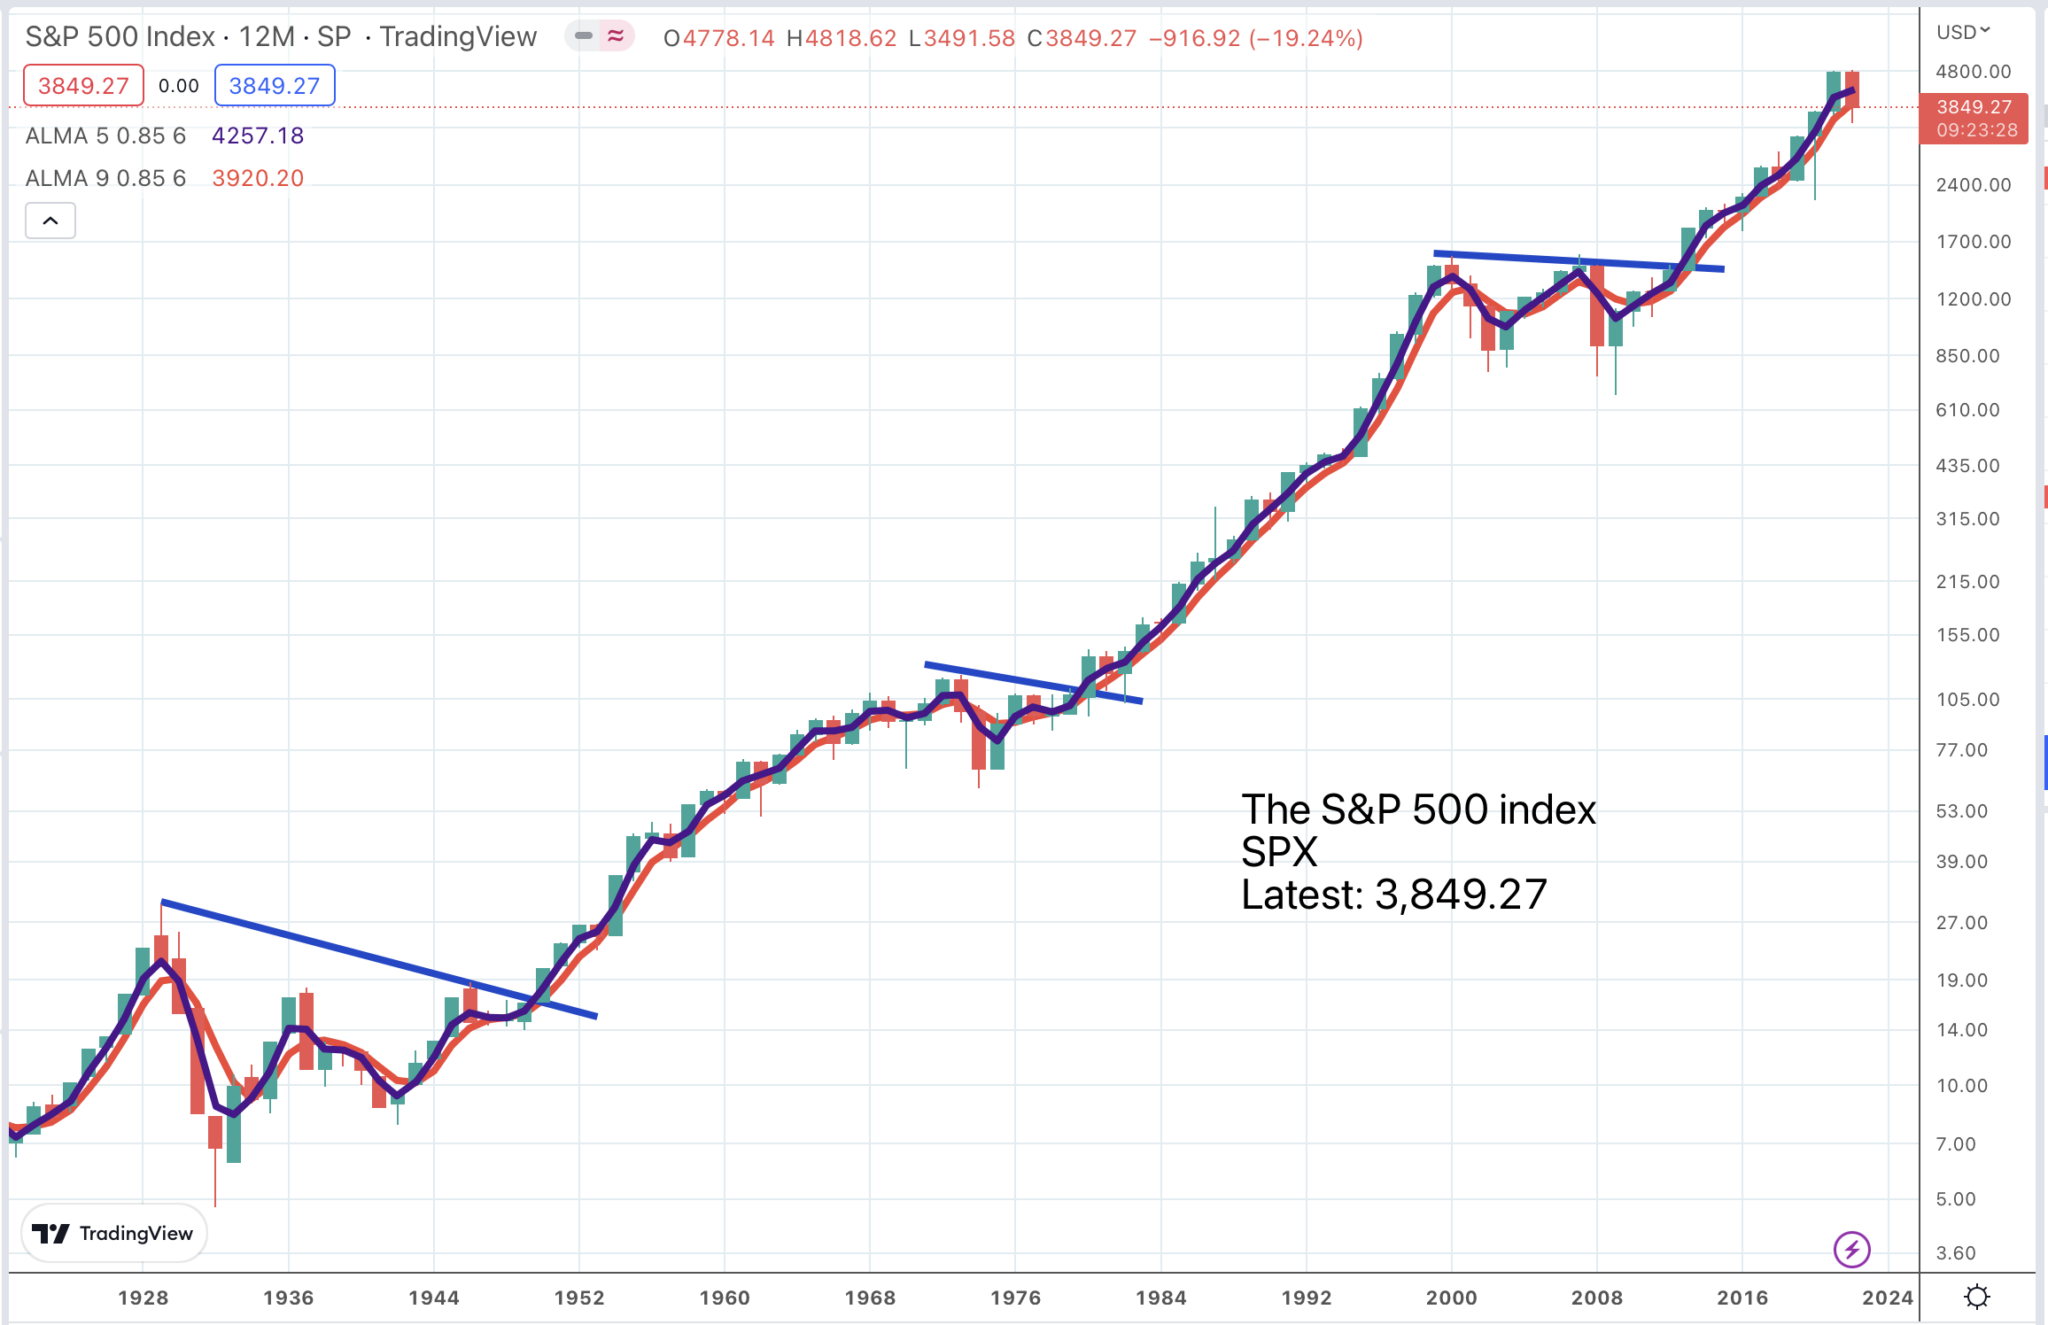
12 month candlestick charts show the big buying opportunities for the S&P 500
We can look at even longer term charts than 6m. Below is a 12m candlestick chart of the S&P 500 going back nearly a century. What we can see is three massive chart breakouts. They are rare with the last one occurring in 2013. The question now is do we need to build a multiyear consolidation before we can have an exciting new bull market. If we do I may not be around.
Another possibility is that the current bear market is not a monster on the scale of the 1930s, the 1970s or the first decade of the 21st century but more of a big correction, even a mid-term correction. This interpretation ties in with the idea that the global economy is being transformed by an accelerating technology revolution and the impact of globalisation, which has created a worldwide middle class of affluent consumers with massive spending power.
investors in the first two decades of the 21st century have been excited by a class of shares known as disruptors. Netflix has enjoyed huge success from disrupting the DVD and then the TV industry, Tesla has disrupted the fossil fuel motor industry, Amazon has disrupted e-commerce and data storage (through AWS), Alphabet/ Google has disrupted the advertising industry and so on and so on. I don’t think the age of the disruptors is remotely finished yet and the addressable market for these disruptors grows ever bigger. The scene is set for more individual company growth stories and they will take place against the background of monster chart breakouts.
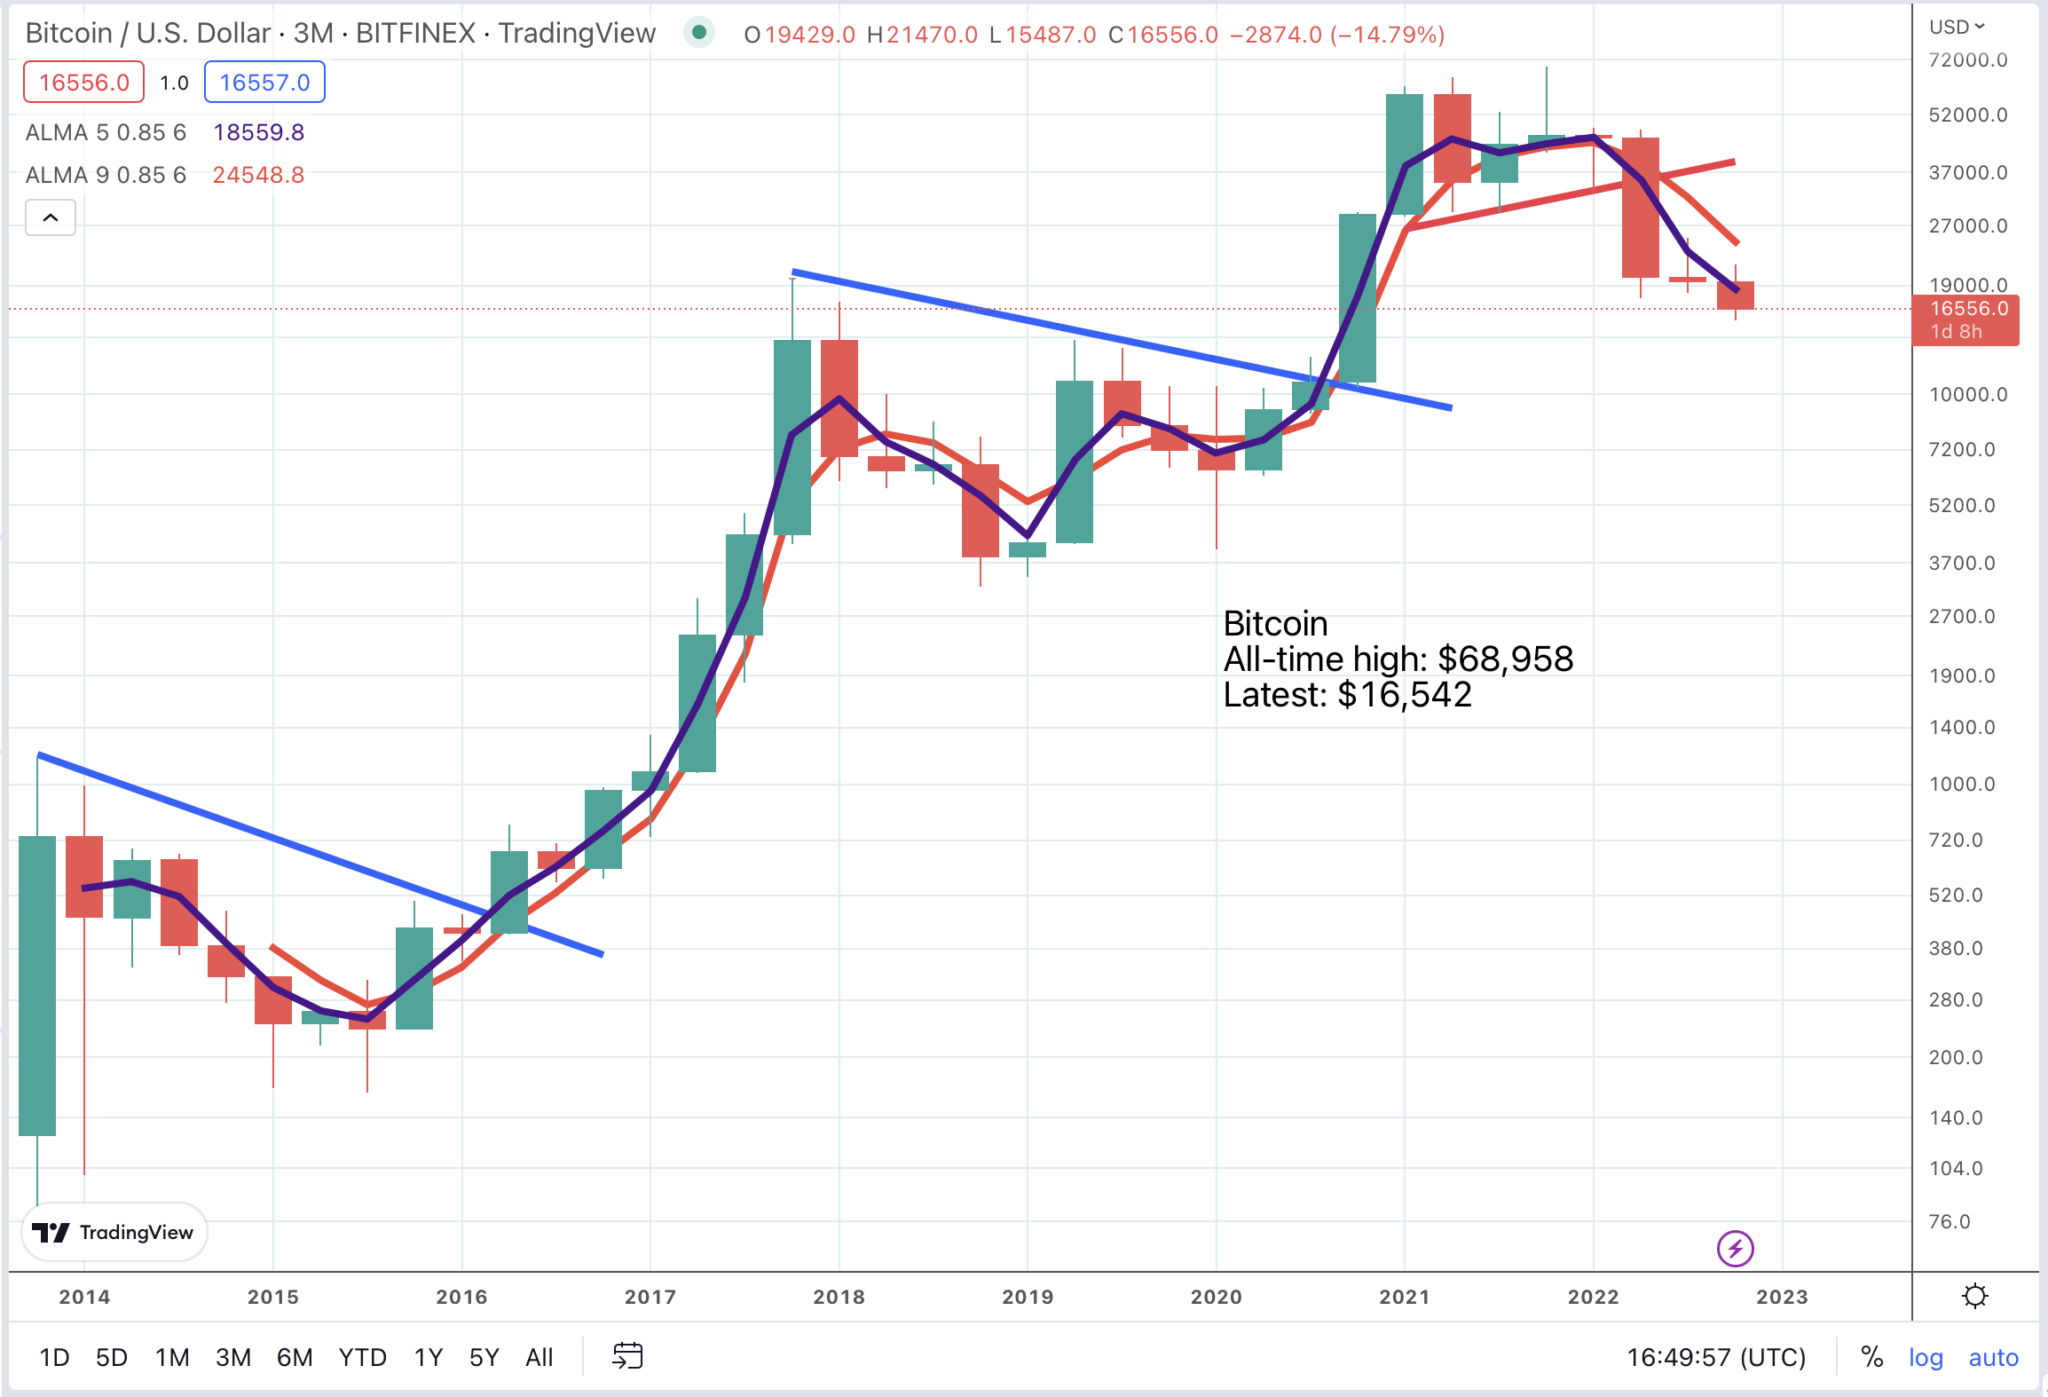
Meanwhile another key benchmark, bitcoin, looks threatening. You can see on the chart two huge upside breakouts, both of which we identified on Quentinvest or former publications. Since then the chart has made a breakdown from a significant top area. The odds favour lower levels ahead for bitcoin and other leading cryptocurrencies. There is strong support around $8,000, which therefore becomes something of a target.
Bitcoin still heading lower
Bitcoin is a technical beast. For me it is all about charts, which is why it is incredibly exciting when we see these massive upside chart breakouts but why it should be avoided during downtrends. Bitcoin doesn’t have a floor, it just has a price.
One thing we have to accept about my analysis of all of these charts is that we are all geniuses with 20:20 hindsight and that can make investing look easier than it is in real time. It is not easy but it is not impossible. Subscribers will know that I called all these breakouts on Quentinvest and before that on my print publications. I use charts and I make them work for me so I know I can do it. I also know I can do better and my war chest of indicators is getting better all the time. Coppock especially could be a game changer.
I am looking forward to the next bull market with great anticipation.
Palo Alto – great fundamentals, weak chart
Another instructive chart to look at is for cyber security business, Palo Alto Networks. It has great fundamentals.
Here are some quotes from the latest quarterly earnings report to establish how great are those fundamentals.
On the top line, billings grew 27pc year over year, while RPO [remaining performance obligations] grew 38pc. We have consistently maintained that cybersecurity is the most innovative sector of the technology industry. Demonstrating progress on our transformation, we have shared how our new cloud delivered and cloud-enabled offerings are contributing to our business via our NGS ARR [Next Generation Security annual recurring revenue]. In that context, this quarter, our NGS ARR hit a key milestone.
It crossed the $2bn mark and grew 67pc year over year. As the macroeconomic environment changes, we are accelerating our efforts to drive incremental operating leverage in our business. Given that we’re the largest independent cybersecurity business, we can meaningfully improve our margins over the next phase of our company’s life cycle. Our focus on profitability in the quarter drove operating income growth of 44pc year over year, with operating margins up 260 basis points during the same period.
We also generated over $1bn in free cash flow in the quarter. For the second quarter in a row, we generated net income on a GAAP basis as we focus on GAAP profitability for the fiscal year. At the center of our strategy is the need to drive more consolidation to get customers to a better security posture. Towards that end, we continue to see large cross-platform buys and grow our millionaire customers at a steady clip.
Q1 2023 earnings, 17 November 2022
We know the fundamentals are great but what about the chart. We can see three massive chart breakout buy signals in the past which tied in well with Coppock buy signals. Coppock typically sets the scene by signalling first but not invariably.
Coppock downturns have also been good at setting the scene for periods of consolidation to build when it is usually best to avoid the shares. The present position, despite those great fundamentals, is that the shares are in a downtrend with a falling Coppock. Coppock has been falling for a year and is close to negative. The chart looks weak. There is no reason to buy these shares yet.

Strategy
Quentinvest for me at the moment is all about getting ready for the next bull market, which I expect to offer many exciting opportunities. At the moment though the overwhelming message is of weak charts and the possibility of lower share prices ahead.
Not a bad rule is that big bear markets end with big bankruptcies. Somebody out there is really feeling the pain.
As Warren Buffett said
“Only when the tide goes out do you discover who’s been swimming naked.”
Warren Buffett
If we get a massive bankruptcy that would colour my attitude to the charts. Absent such an event we need to be cautious. If you want to invest keep it small. The opportunities will come.