Charts more important than fundamentals as the great plummet continues
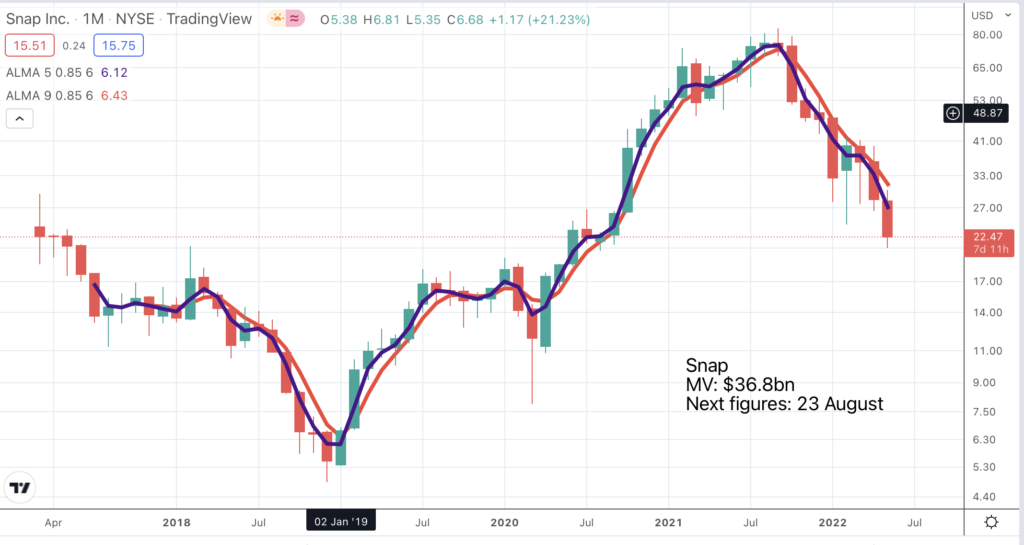
After reporting disappointing figures Snap shares are expected to open some 30pc down even on the depressed level shown in the chart. Did any fundamental analysts tell us that was going to happen? I don’t know but I am sure not many otherwise the shares would never have climbed so high in the first place. Using fundamental analysis to tell what shares are going to do, especially high-flying shares, is very difficult. My impression is that charts can be much more helpful.
Fundamental analysis can tell us that company X is exciting and fast growing but after that, like bitcoin, it is all about charts. In the chart above the clever thing to do is to hold Snap shares while the moving averages are climbing and avoid them while they are falling.
Another indicator that can be helpful is Coppock. In the case of Snap, Coppock began falling in August 2021 and has just become negative. The next buy signal is likely to be important.
Charts also help us to avoid making mistakes. Time and again in my life I have looked at the fundamentals and found them so exciting that I have decided to buy the shares even when the chart looked negative. I am increasingly of the view that investors should never, never, never, ever do this. So don’t do it, OK.
At its simplest this means never buy a share when the moving averages are falling. If they are going to be a great investment the moving averages will turn higher and that will be the time to buy. Better safe than sorry because in the case of shares like Snap being sorry can mean being very sorry. Just in one day they have dropped from $22 to $13.65 as investors reacted to the figures.
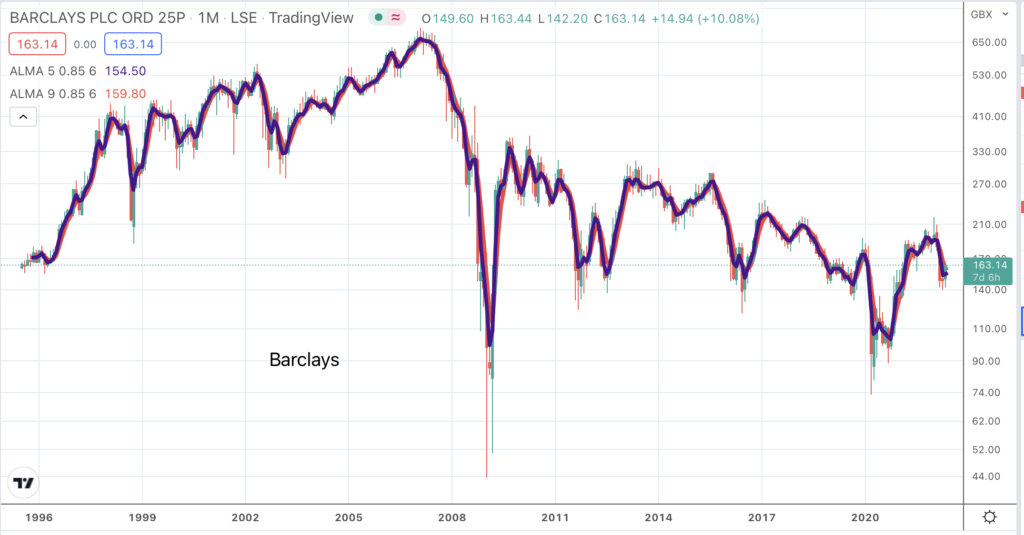
My experience is that charts work better with high momentum shares. If we look at a chart of what I would call a boring old fart stock, Barclays, the people I bank with, nothing works with a chart like this, neither fundamentals nor charts because the price never really goes anywhere. In over a quarter of a century the price has wobbled up and down and ended up almost where it started. So don’t even think about buying Barclays shares unless Elon Musk becomes the new chief executive and even then probably not because it would suggest that Musk had become completely insane.
When I was younger I studied charts. I read books and really got into it but the truth is that like philosophy which I studied at university, most of it is mumbo jumbo. This led me to my simple rule. If the message (in the charts) is not obvious there is no message. The corollary of this (try spelling that word right every time) is that you should not be frightened if the message is obvious. The Amazon share price chart shows a massive breakdown. It could not be more obvious. The price was around $3,250 when it broke down and now it is $2,151 and on this chart it looks as though there is more downside to come. We have become so accustomed to companies like Amazon walking on water as it were, showing amazing growth whatever seems to be happening that we are just not ready for a rough period. The chart suggests that a rough period is coming.

This doesn’t mean it is always easy to know what to do or even ever easy to know what to do. When I worked in the City I noticed that there was a certain kind of merchant banker who had always done everything right, bought shares before the boom and sold before the crash. Obviously a useful guy to know. But when I ask him – so what do we do now. Suddenly it is no longer so clear as the guy waffles in every direction and you realise that he doesn’t have a clue either.
The eternal truth of stock markets is that nobody has a clue beforehand but there are many geniuses afterwards. If we are sensible we make our best guess and hope that it is right. My best guess is that this market hasn’t finished falling yet; that there is more bad news to come out of the woodwork but that I will keep an open mind and when my indicators change direction I will run with that and let you guys know.
What we can say is that this is turning into a classic bear market, one, I must confess, I was hoping we would not have again or at least not for a long time. But, I suppose, on the basis of my friend, Robin Griffiths’s rule that in order to crash shares must first fly they have been flying, very high indeed so the crash is equally devastating.
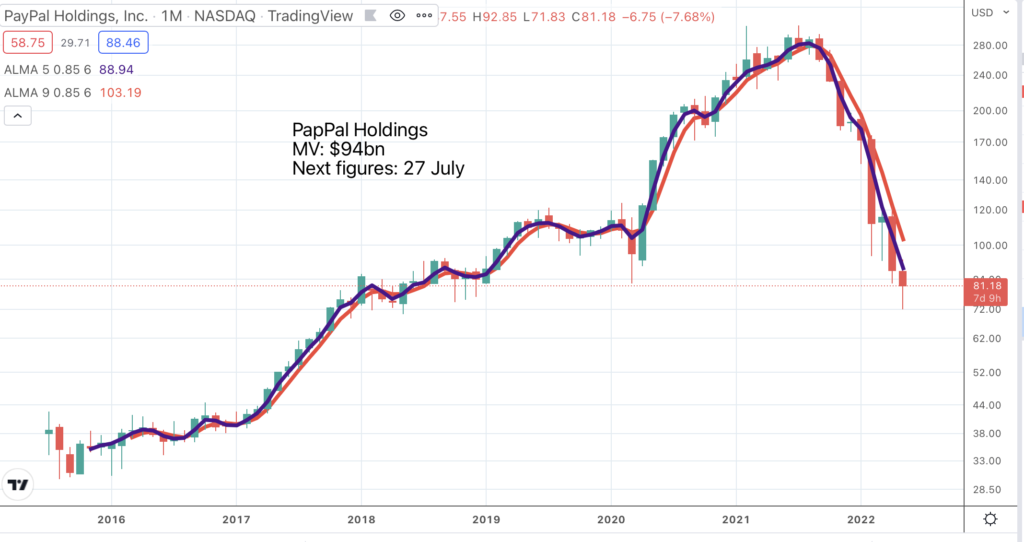
More and more I am seeing parallels between what happened in 2000-2003 and what is happening now. The Nasdaq Composite had an incredible bear market. It fell some 77.7pc between March 2000 and November 2002. I don’t think anything like that is going to happen to the index this time but it is happening to many individual shares. Paypal was one of the stalwarts of the bull market. The shares peaked at $310, making an almost perfect double top in February and July 2021, and broke down around $250 in October 2021. At the latest price around $81, they are down 73.8pc and the indicators I follow remain as negative as ever. The Coppock indicator is down from around +223 to -81 so the next buy signal should be a cracker.
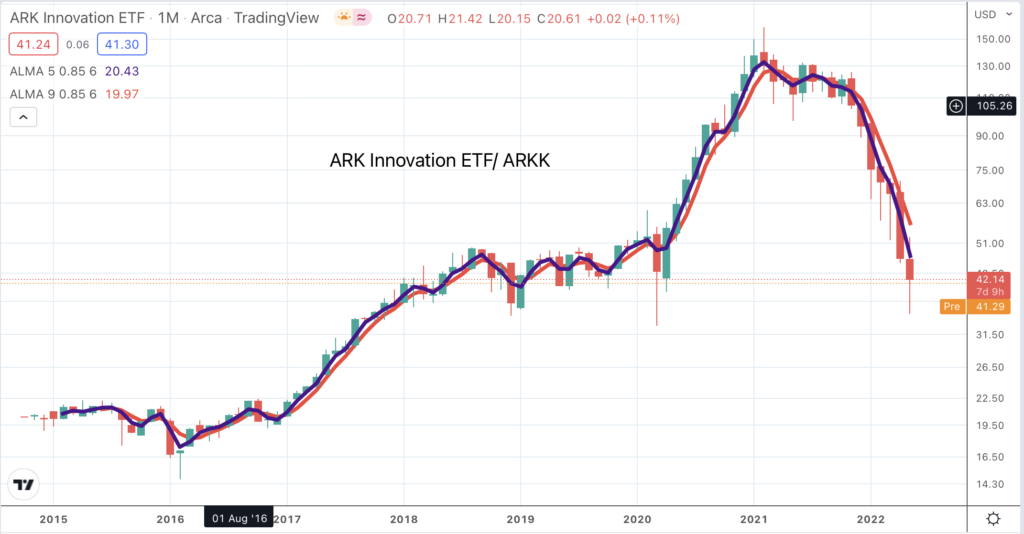
The other kind of charting that can be helpful, as noted in the Amazon chart above, is pattern analysis. Chartists have all kinds of different names for the different patterns, triangles, head and shoulders and many others but for me they are all just patterns, areas of sideways trading. When the price breaks up or down from a significant pattern we can expect an important move. We can see this with the chart of ARK Innovation ETF below, one of the ETFS in the stable of Cathie Wood, famous for her bullishness on Tesla.
There are three distinct areas of consolidation on the chart. The price broke up twice and broke down once and each one led to a big move in the direction of the break. You don’t need a PhD in charting to read the message of these charts. So why do they work? Why doesn’t everybody immediately act on such obvious chart signals.
I think it is because there is so much data out there on fundamentals, on charts and it has all become so complicated that people cannot see the wood for the trees. This is why I am obsessed with keeping it simple. I know what works for me and I don’t bother with anything else. Even then it is never that simple. When we look at this chart we know what happened (20:20 hindsight) and that helps a lot with the analysis. Like the merchant banker if you ask me what is going to happen next I don’t know but what I do know is that until I get a buy signal from the indicators I use I won’t be buying these shares.
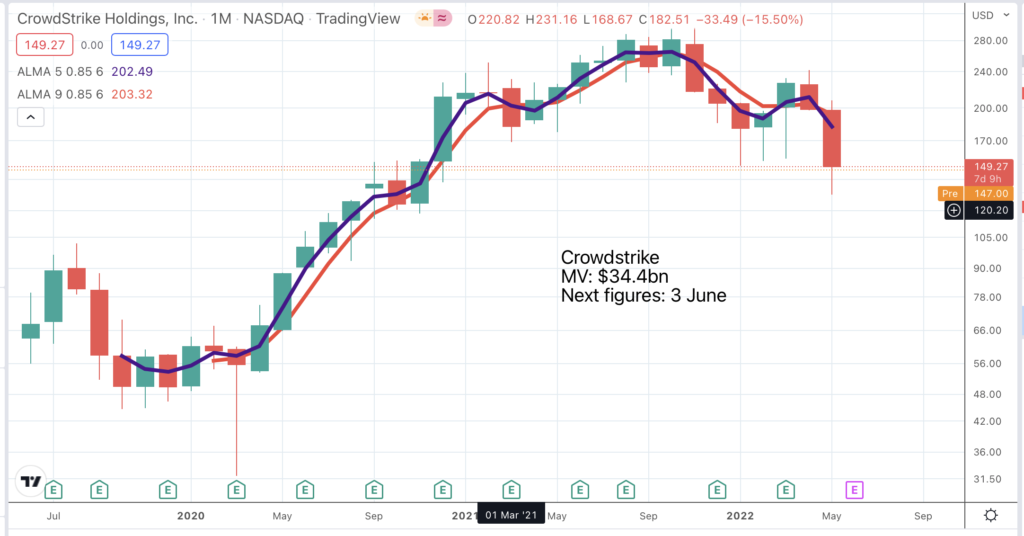
Yet another problem with bear markets is that you cannot trust the shares which seem to be bucking the trend. You might have thought that a full scale cyber war between Russia and the West would be good for cyber security shares. It is probably good for the businesses but in a bear market nothing works for the shares. One of the last shares I held before I went almost completely liquid was Crowdstrike. The business was on fire, maybe still is but the shares have tanked. This could even be a head and shoulders pattern (see below) and the shares could collapse. If I look at that chart it seems that the line of least resistance is down and the shares are looking over a cliff. That’s what happens in bear markets. Shares fall, big time. What does Coppock say for Crowdstrike. It has been falling since June 2021 and is almost negative.
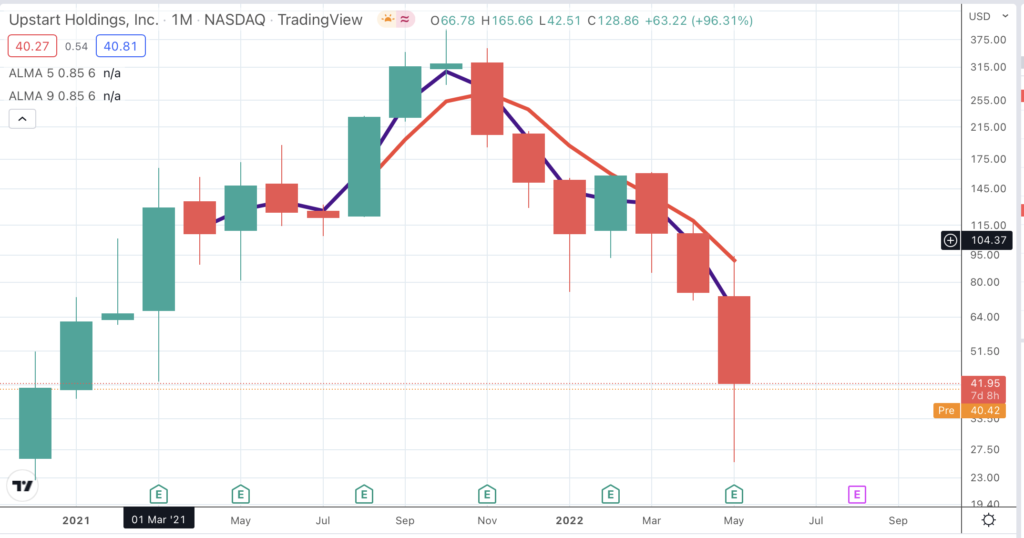
Another thing that happens in bear markets is that good news is seized on to spark a rally but most rallies don’t last. They are like bull traps which suck investors back into the market before shares fall again. A share about which I have been very excited in the past is Upstart Holdings. The ex-Google founders set out to disrupt the market for loans with new high powered algorithms to determine who would and wouldn’t repay their loans. Looks like the Holy Grail for lending banks and it seems to work.
So what happened to the shares when the moving averages turned down in December 2021. The price fell from a peak $401 reached in October 2021 to a recent low of $25. F**k! What is the use of fundamentals, whereas the charts have been very helpful. And this has happened despite some good news from Upstart on the way down. Looking at the chart you might imagine that the CEO had shot himself. Not a bit of it.
This is what the CEO said about Q1 2022 results, reported 10 May. “The Upstart team just delivered our seventh consecutive profitable quarter and our fourth straight quarter with triple-digit year-on-year revenue growth. As the recognized innovator in AI lending, we continue to expand our leadership position in personal lending and are now off and running in our auto lending product as well. Despite the macro headwinds that appeared over the first quarter, we saw loan transactions of more than $4.5 billion, a record for the Upstart platform and perhaps for the industry as a whole. At the same time, we added a huge number of lenders and car dealerships during Q1.”
The interesting possibility is that investors are being as extreme on the downside as they were on the upside. If that is correct the next buy signals, when they finally arrive, could usher in a magic period for making money.
There is one set of fundamentals that has been useful and that is the trend in interest rates. I have some chunky mortgages and I just saw what is happening to the servicing costs. Ouch! I am probably going to see the same when I see my new gas bills. Stocks really don’t like higher inflation and rising interest rates so as long as the latter are pushing higher and are arguably out of control that is not a good backdrop for shares or bonds or it seems cryptocurrencies.
There is going to be endless speculation that inflation and interest rates have peaked but these things are as unpredictable as share prices. There are no experts, just more plausible bulls******s. Jeremy Clarkson, who is probably as switched-on a commentator as anyone else, says we are heading for an apocalyptic food crisis. Who would have believed it but then again I have always been amazed that there is so much food around. If people want to eat more and better, free-range chickens etc., then everything needs to cost more including my beloved haddock and chips from my local chippie and that is going to be a serious reality check for us all and maybe not one that can be dealt with by raising interest rates. We really do need to tighten our belts and not before time my skinny eco warrior daughter would say.
It really is insane that the world is running out of food while western hospitals are over-run by obese people. Those whom the Gods would destroy they first send mad. It seems the chickens are coming home to roost. What does seem likely is that since higher inflation and rising interest rates have only recently become a problem they are not going to go away just like that; solutions may take time.
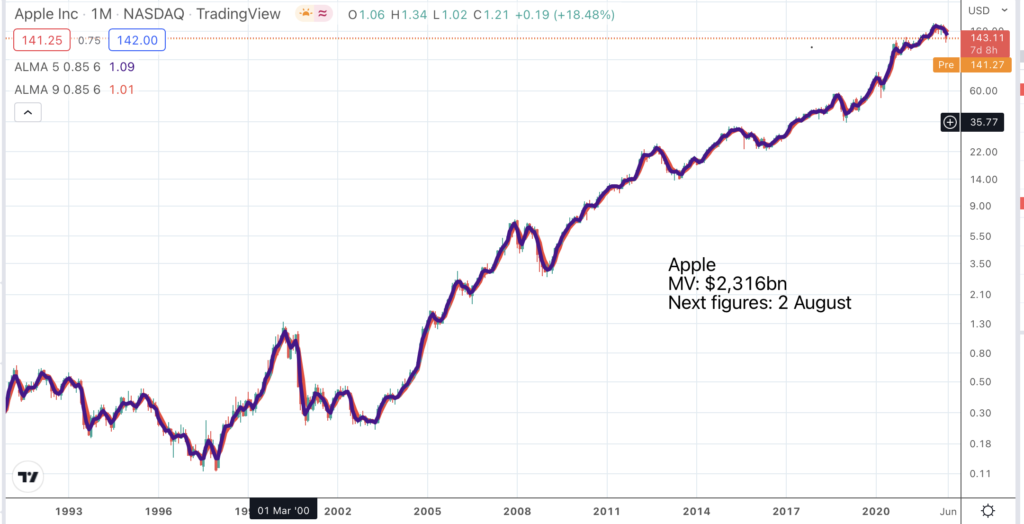
It is all about something new. Rising inflation and interest rates are something new, at least in recent memory, which stock markets don’t like. Something new also happens with individual stocks. Steve Jobs returned as CEO of Apple in 1996 and began working with designer, Jony Ive, to develop new products that were launched, starting in 2001. The effect was amazing as though little old Apple had acquired super powers and the shares began an incredible climb.
Unlike many shares they are still up there which is one reason why indices like the Nasdaq 100 have held up relatively well while many constituent shares in the technology sector have plunged. Can Apple continue to defy gravity? The moving averages have given a sell signal and the Coppock indicator has been falling since December 2020. There is no buy signal so this is one to watch and wait but given the general environment investors will be understandably nervous about prospects. There are no safe havens in bear markets.
Another thing about bear markets is that they are gloom and doom until they aren’t. Just when all logic tells you that everything has gone to blazes and shares can never recover that is when they do. The bottom comes when we feel most miserable, which is why we cannot trust our emotions but must use objective data like my indicators. Most people don’t do that but are are driven by their emotions or trying to figure it out based on what they have just read in the newspapers or whatever which is why using indicators works so well.
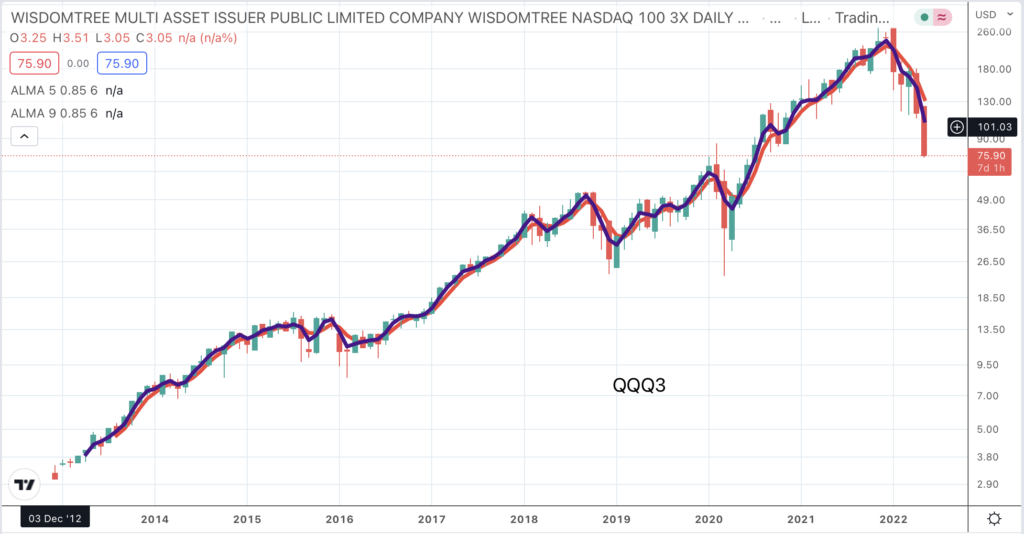
Yet again there are no share recommendations in this issue. We need to keep our powder dry. The last chart we could look at is QQQ3 where my recent purchase is already showing losses and I suspect there is worse to come. If you look at the chart below in an unemotional way it looks like a head and shoulders with a neckline around $112. If we use a slightly more esoteric chart technique (possible mumbo jumbo alert) we can calculate the target from this breakdown as being, at a minimum, the height of the pattern. This gives us a target in the high $40s.
So why did I buy some at $84. Good question. I just have the feeling that QQQ3 is one instrument where buying into gloom may pay off eventually so you build a position and then double up or whatever when it finally gives a buy signal. The obvious alternative is just to wait for the buy signal. At least by having some it reminds me to buy when they do give a signal.
Last but not least don’t forget the importance of short sellers. They are the equivalent to profit-takers in a rising market. Strong rallies are driven not by real buyers but by short sellers covering their positions (taking profits). This is another reason to be cautious of rallies in a falling market. My guess is that when it really turns we will know.

Incredible Chart/ Fundamentals for Advanced Micro Devices (AMD)

Who’s A Scaredy-Cat!

Stunning Micron Results Keep Memory Boom At Full Throttle