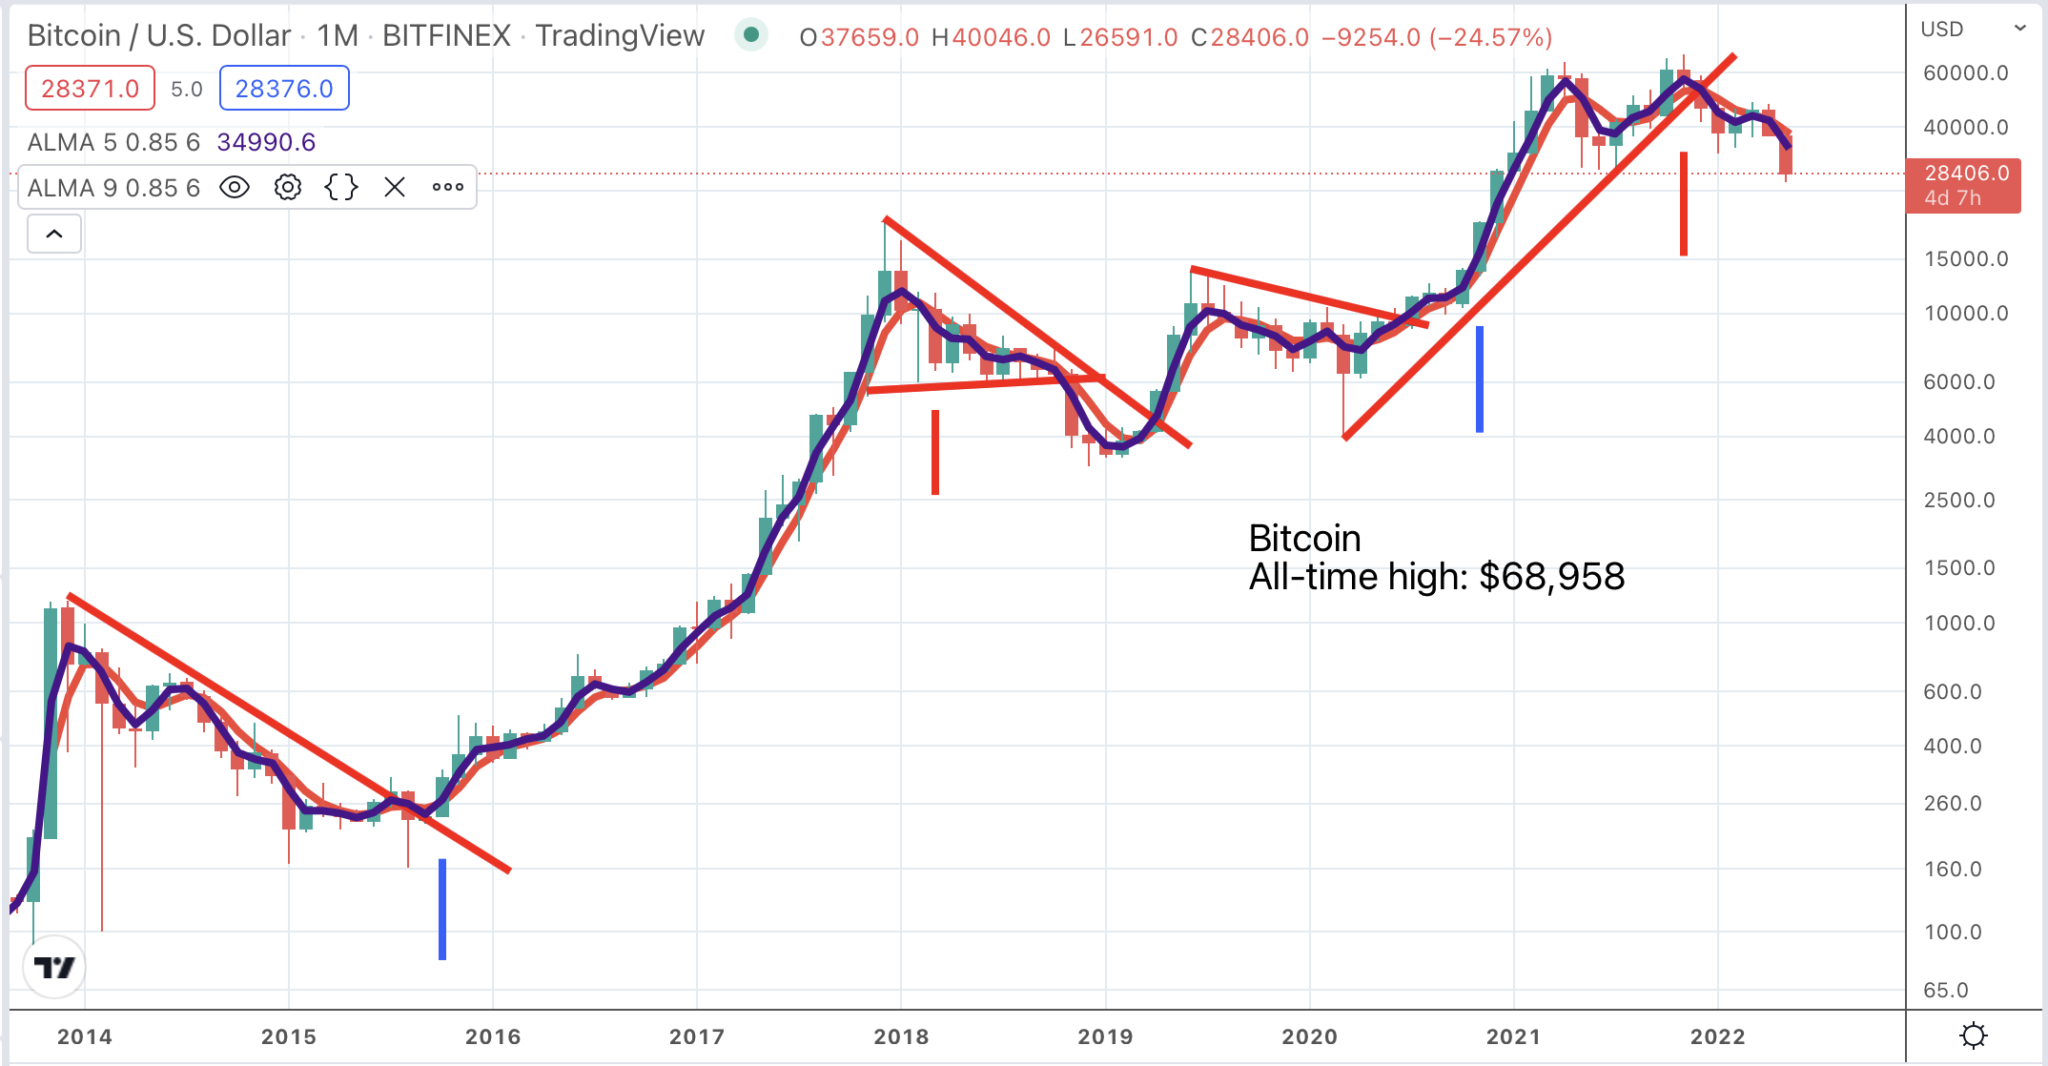
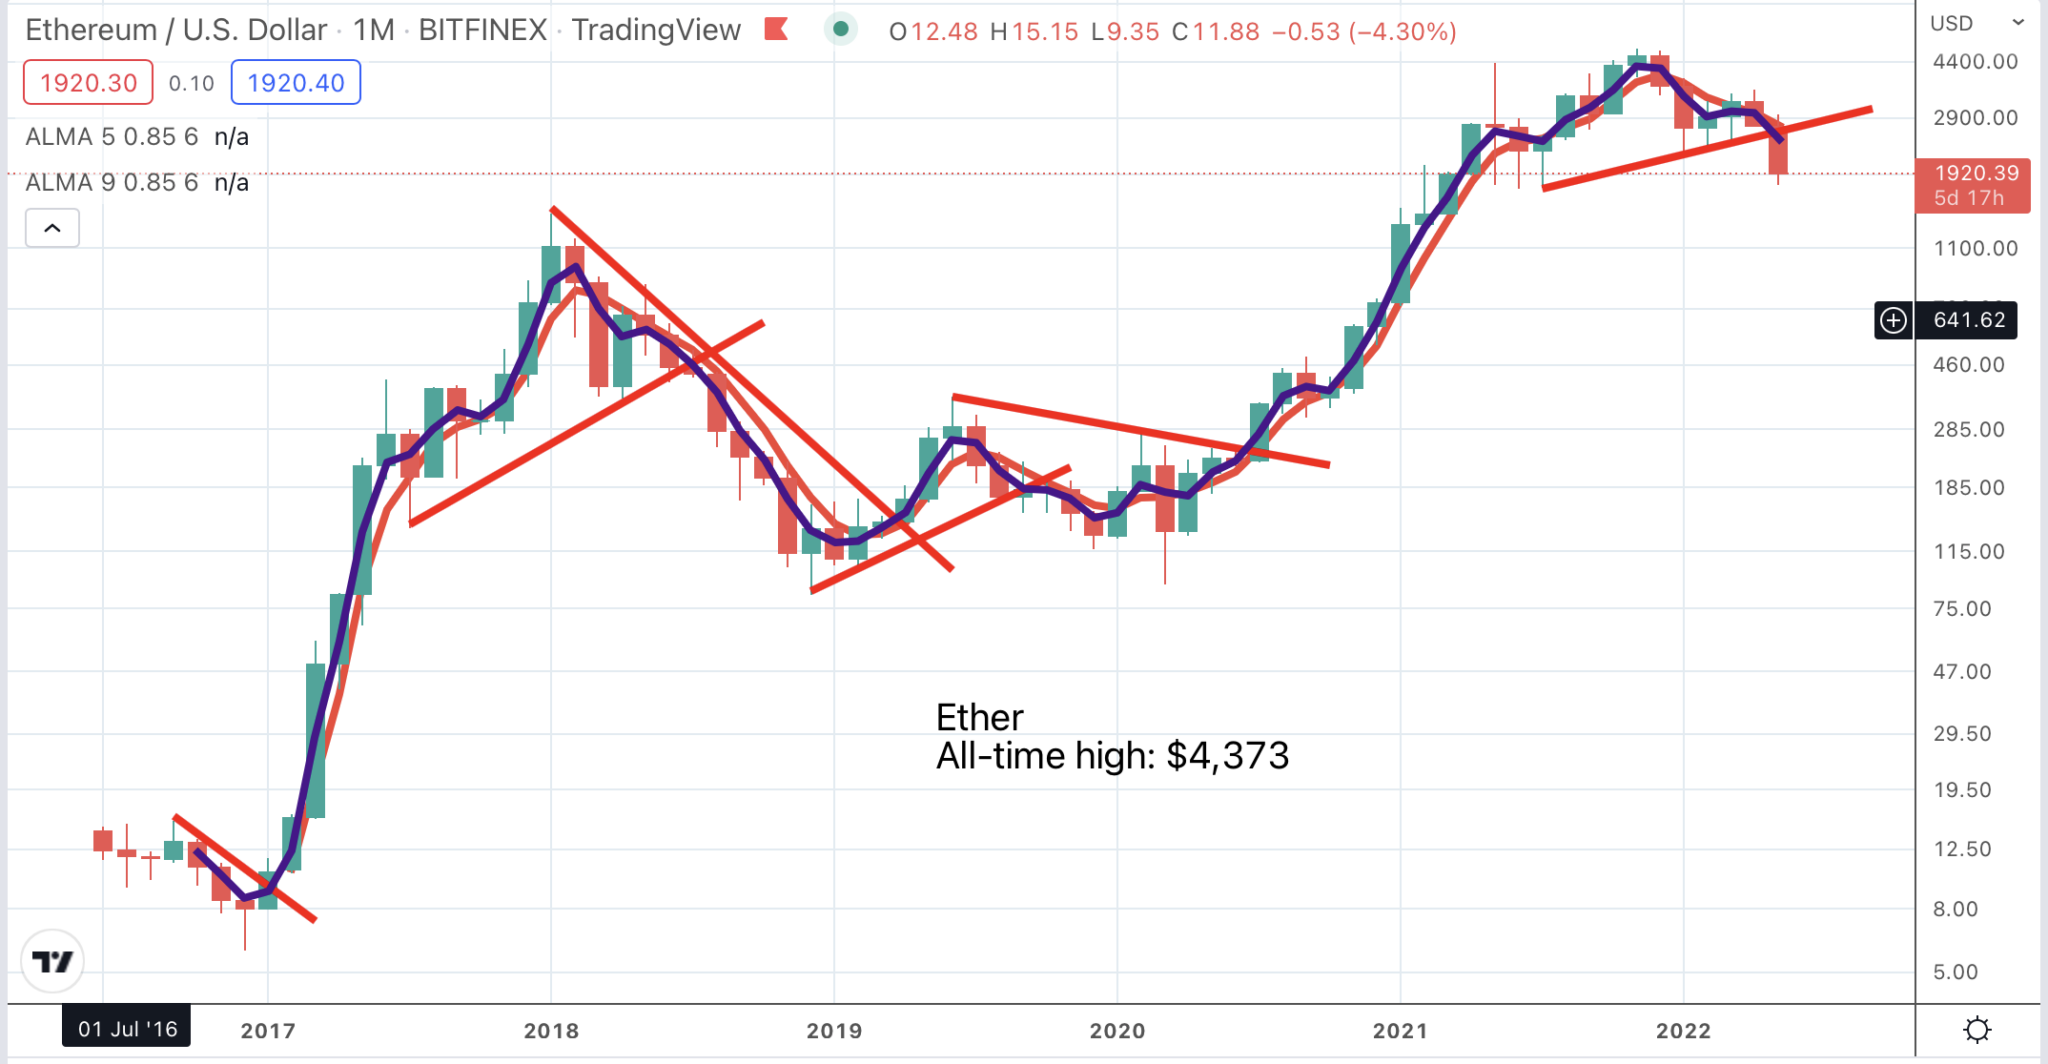
In the chart above I have done something I don’t usually do which is draw in lots of lines. I don’t do it because they give a spurious impression of accuracy. I prefer to just look at the chart and try to read what it is telling me. Is it bullish? Is it bearish? When I look at the chart above without the lines it is bearish. Is it obvious? Yes. So there is a message in this chart which is, duh, sell bitcoin. Ether looks much the same and lite coin I have given up on so sell them too.
Bitcoin is perfect for charting because it doesn’t have any fundamentals. They don’t have a CEO and a CFO and they don’t report quarterly on how trading is going. They just go up and down in line with mysterious forces which I don’t suppose anyone understands. More buyers than sellers or vice versa as the market makers tend to say if asked why a share is moving.
The corollary of this (using my new favourite word again) is that so far bitcoin has worked incredibly well from a chartist’s point of view. You can see the moving averages on the chart. Signals are given whenever the red and blue lines start rising or falling together so not rocket science to read those although they are not as easy to read in real time as the chart might suggest. They are clearly falling now which is bearish until they change direction.
Next are the trend lines. A signal is given when a line is broken. On the chart you can see buy signals in late 2015, spring 2019, and autumn 2020. There was a sell signal in November 2018 which was quickly reversed. Chartists call that a bear trap and a bear trap is usually bullish because all the bears who sold have to buy back in. I would have been bearish in November 2018 based on the chart. The next sell signal was another November, November 2021, which was when the whole US stock market peaked bearing out my contention that in investment terms bitcoin is just another share.
Thirdly, on the chart, I have marked the important changes of direction by the Coppock indicator. In late 2016 and late 2020 we have buy signals (blue vertical lines), both of which worked well and so far, if we use a falling Coppock to generate a sell signal (not approved of by creator, Edwin Coppock), the sell signals (red vertical lines) have worked well.
Lastly we have pattern analysis, where the price breaks up or down from a large area of consolidation or sideways trading. In order to have a pattern breakdown or breakup you need a clear pattern. There have been two pattern breakdowns. The first in November 2018 was quickly reversed. The second has just occurred.
Presently, as far as bitcoin is concerned all my indicators are negative and I would be a seller.
There is a line of support around $29,000. I don’t expect it to hold but if we start seeing buying signals I would change my mind; that is how charts work. if bitcoin breaks down further from here, which is what I expect, based on the charts, we could see a collapse. Bear in mind that as recently as March 2020 the price fell to around $4,000.
The chart for ether works equally well and looks similarly bearish with a risk of a serious price collapse. There is support around $1,900 where the price has bounced on several occasions in the past. If that is broken on the downside there could be a torrid period ahead.

I don’t hold any cryptocurrencies and based on these charts I would not want to; as well as the charts I would be wary of holding such blue sky zero return investments during a period of rising interest rates but, as we know, when we do get buy signals for these cryptos they can deliver incredible gains.

Incredible Chart/ Fundamentals for Advanced Micro Devices (AMD)

Who’s A Scaredy-Cat!

Stunning Micron Results Keep Memory Boom At Full Throttle