Benchmarks still negative as emphasis shifts from growth to balance sheets
I am going through my table of benchmarks (indices, ETFs, cryptos, investment trusts and individual stocks) which I do at least once a month to build a snapshot of what is happening in markets. The picture turned negative in November 2021 and has stayed negative ever since as a ferocious bear market has shaken out over-exposed investors.
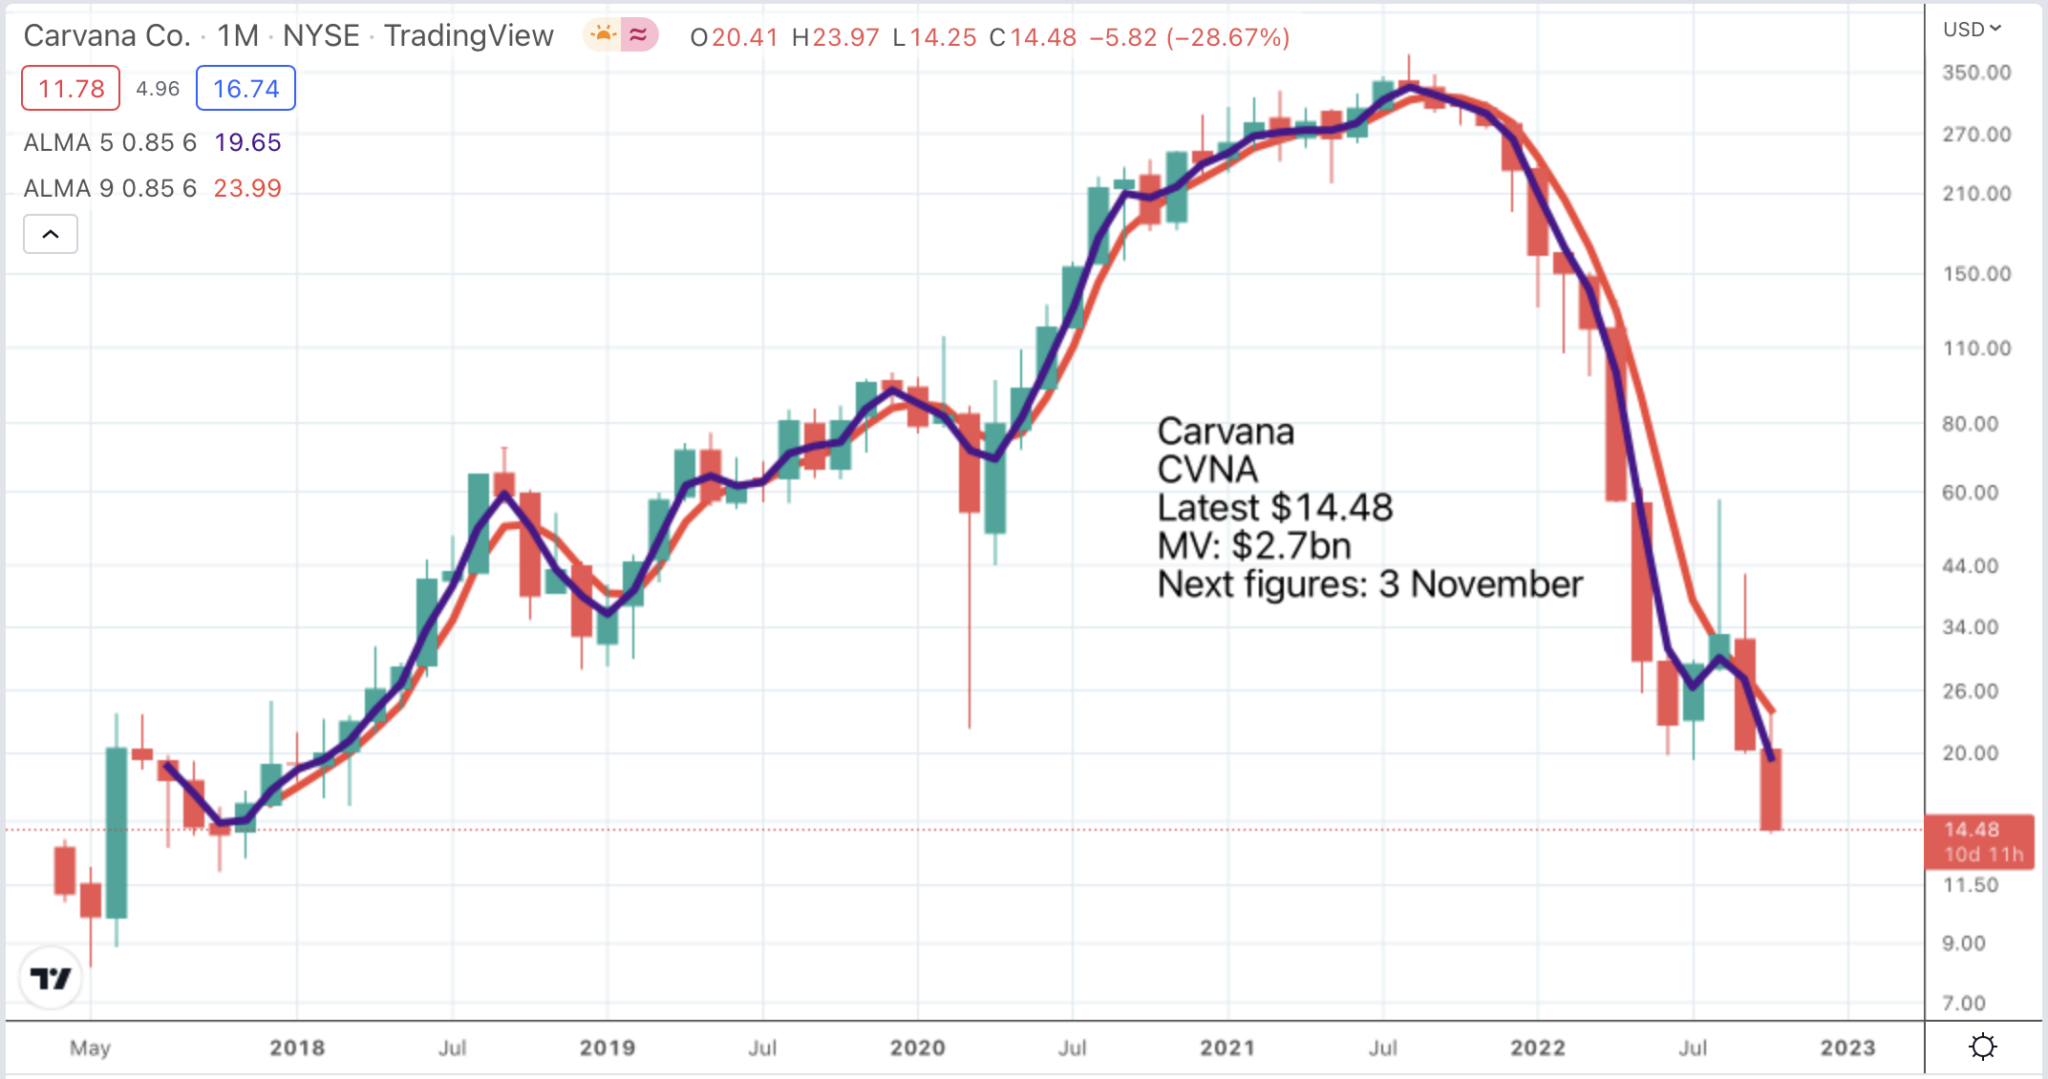
There have been some spectacular falls in individual shares of which one is charted above, Carvana. The story here is that a group of Stanford and Harvard graduates with strong financial backing, albeit from a guy who had served time in jail for fraud, set out to transform the huge US car market with the application of technology.
The growth in sales and market share was explosive and drove a massive rise in the share price as investors came to believe that these guys were going to deliver on their ambitions. But then life became tougher. In the recent past demand for used cars has been falling sharply and prices are also coming down. This exposed Carvana as having allowed costs to build too high and the group had to make a dramatic shift from chasing growth at all costs to trying to manage costs.
The second quarter was probably the most dynamic quarter we’ve had at Carvana. We shifted our priorities for the first time in company history to favor efficiency and cash flow in recognition of the changes to the market and the economic landscape as well as to enable us to quickly adjust to changes in our industry that had caused our expenses to be out of balance with sales volumes.
Q2 2022, 4 August 2022
The worry at Carvana is that a bit like equipment rental companies the company holds large stocks of work in progress (used cars) and these are financed by debt. Latest debt is around $7.5bn and with free cash flow running at around minus $1.5bn and shareholders equity around $300m suddenly Carvana’s position looks scary or ‘challenging’ as CEOs like to put it.
Investors are running for the hills. In the past these balance sheet driven panic attacks have created spectacular buying opportunities (a famous example was UK and US plant hire business, Ashtead, in March 2003, when the price fell to 2p against 4,167p currently and a 52 week high of 6,270p; that’s right, up over 3,000 times). The guys running Carvana are clever and highly motivated. They could easily come out of this looking good but right now there is a new breakdown on the charts and the darkest hour may be still to come. The darkest hour, as with Ashtead, would be when the company is perceived as battling to avoid bankruptcy.
Just for the record the Coppock indicator for Carvana turned down from plus 464 in June 2021 to minus 170 currently.
Crowdstrike shares walk a tightrope
Chartists talk about share price charts showing periods of accumulation and distribution. As is clear with 20:20 hindsight, shares in cloud security business, Crowdstrike, were being accumulated between June 2019 and April 2020, when the price began soaring from a low of $31.50 to a peak $295. The question now is whether all the trading between December 2020 and today is another period of accumulation or a period of distribution.
Just to the naked eye it looks to me more like the latter in which case these shares could be in danger of falling sharply.
There is a line of strong support around $150. This was broken in May and the shares rallied sharply to $206 but the rally petered out and ominously the moving averages have rolled over in a new dead cross. The Coppock indicator began to fall in June 2021 and recently turned negative. You could say these shares are hanging by a thread.,
Crowdstrike has net cash and positive cash flow so any problems it might have are not balance sheet related. It is all about growth and demand and maybe, as we have seen with some of the mega caps, cost structures designed for growth which look exposed if demand growth slows.
I have to say the latest results for Q2 2022, reported in August, were sensational.
The CrowdStrike team delivered a strong second quarter headlined by record net new ARR [annualised recurring revenue] of $218m as growth accelerated to 45pc year-over-year, record net new customer additions and record non-GAAP operating profit. We achieved several additional milestones in the quarter. Ending ARR grew to $2.14bn on a 59pc year-over-year growth rate.
We believe this makes us the second fastest software company reported to reach the $2bn ARR milestone. Ending ARR for our emerging products grew to $219m, up 129pc year over year. This included record-setting net new ARR for both Identity Protection and Humio and we also achieved record net new ARR for modules deployed in a public cloud. Quarterly revenue exceeded $500m for the first time.
Cybersecurity is a priority for CIOs, CEOs and CFOs and boards of directors, and our value proposition resonates strongly with these stakeholders. Deals committed to close in the quarter did close in the quarter, and we entered Q3 with a record pipeline.
Q2, 2023, 30 August 2022
Frankly, looking at those fundamentals, it is very much a case of not a chink in the armour but nevertheless the chart makes me wary. Carvana has problems and their shares are down 95pc. Crowdstrike does not appear to have any problems so their shares have halved. Both shares in their different ways could offer opportunities going forward but presently look best avoided, like the stock market as a whole.

Datadog looks toppy
Datadog shares are testing a powerful line of support around $80. If this fails to hold the next important support is in the $40s. Given what is happening in the stock market generally and the pressure put on valuations of high growth stocks like Datadog the odds must favour the line not holding and the shares falling further.
Like Crowdstrike the shares attempted to rally. The rally has failed and we have a new dead cross by the moving averages. The Coppock indicator is down from plus 133 in March 2022 to minus 15 currently.
A characteristic of bear markets is that support levels don’t hold so again that makes it likely that this support will eventually fail. Put another way the bulls are still fighting for Datadog and sentiment towards the stock may need to deteriorate further before we can reach the bottom.
The bulls are hanging in there because of the great fundamentals.
We are pleased to report strong results in Q2 as we executed well, and we extended our category leadership. Let me start off with a review of our Q2 financial performance. In Q2, revenue was $406m, an increase of 74pc year over year and above the high end of our guidance range.
We had about 21,200 customers, up from about 16,400 in the year-ago quarter. We ended the quarter with about 2,420 customers with ARR of $100,000 or more, up from 1,570 in the year-ago quarter. These customers generated about 85pc of our ARR. We generated free cash flow of $60m and a free cash flow margin of 15pc.
And our dollar-based net retention rate continues to be over 130pc as customers increased their usage and adopted more products. Now moving on to this quarter’s business drivers. In Q2, while we overall saw strong customer growth dynamics, we have seen some variability in growth among our customers. We saw our larger spending customers continue to grow but at a rate that was lower than historical levels.
We recognize the macro environment is uncertain as we look into the back half of 2022. But we also see no change to the long-term trends toward cloud-based services and modern DevOps environments, and observability remains critical to that journey.
We continue to drive market leadership and offer our customers value, efficiency and cost savings to solve their complex monitoring problems. As a result, we continue to feel very confident in our opportunities. We believe cloud migration and digital transformation are drivers of our long-term growth and our multiyear trends that are still early in their life cycle. And we believe it is increasingly critical for companies to embark on these journeys in order to move faster, serve their customers better and in times like these become more efficient with their infrastructure and engineering investments.
Q2, 2022, 4 August 2022
Like Crowdstrike, Datadog has a rock solid balance sheet with net cash and strong free cash flow. It is obviously a wonderful, very exciting business but the chart still looks threatening. I want to buy shares in companies likeDatadog when the chart looks as good as the fundamentals.

Okta shows what happens when the fundamentals turn south
Shares in Okta show what happens if a company makes the slightest misstep in this market.
While the identity market opportunity remains healthy, our Q2 financial results were mixed. We produced better than expected profitability, but our top-line metrics were not where we wanted them to be due to challenges related to the integration of the Auth0 and Okta sales organizations, as well as modest macro headwinds.
We are starting to notice some tightening of IT budgets and lengthening sales cycles relative to last quarter. This leads us to believe that the weakening economy is having some impact on our business.
The sales integration challenges we’ve encountered lay squarely on my shoulders and I recognize we have more work to do to regain our momentum.
Q2 2023, 31 August 2022
The shares started August, just before those results were reported, at $110 and are currently $54 having been lower.

Scary charts everywhere
Wherever you look there are scary charts. Palo Alto Networks is another fast-growing business in the cyber security sector. The chart just looks so like a top area. They are currently testing support around $158 which looks like the neckline of a head and shoulders top. Any sort of sharp breakdown from here would see these shares heading for $85 and to me looks more likely than not.

Another scary chart
Synopsys is a great business. Read about what they are doing and how well they do it and you want to buy the shares. Again though, this chart is saying that might not be a good idea. It reminds me of an expression used in abductive reasoning, whatever that is – if it looks like a duck, swims like a duck and quacks like a duck then it probably is a duck. In this case if it looks like a top, behaves like a top and finally, which hasn’t happened yet, it breaks down from a top then it probably is a top and that is what I think is happening here. Not to be touched, that’s for sure until we see a much better looking chart.

Another possible top area is shown with this chart of Verisk Analytics. A feature of these shares forming top areas is that they have strong fundamentals. Shares in companies not doing so well are not forming top areas, their shares are falling already.

Brunello Cucinelli – swimming against the tide
The chart for Italian luxury fashion group, Brunello Cucinelli, is unusual because it doesn’t look like a top. There is a pattern in technical analysis called a diamond and this looks like a perfect example. Diamond patterns are usually continuation patterns which means the eventual breakout is expected to be in the same direction as the trend before the pattern formed, which in this case is up. The moving averages are rising, having just made a golden cross. The Coppock indicator is still falling, having changed direction from up to down in January 2022.
The fundamentals are good.
“The results of the first nine months of 2022 are really splendid: we are indeed achieving great results thanks to the image that the brand enjoys worldwide for its style, way of working and humanistic conception of business; the above lets us envisage ax extraordinary end of the year, with a growth in sales close to 25pc
There is no doubt that having our production and sales facilities at full capacity – having not laid off anyone during the last two years – allows us to cope with the large quantity of goods requested by the market where, in general, demand exceeds supply. The weakness of the Euro and short production chains are rewarding not only us but the entire Italian fine manufacturing sector, proving how strong our welfare state is
The order intake for Spring-Summer Men’s-Women’s 2023 was excellent, both in terms of image and quantity. All this makes us envisage a 2023 with sound sales growth of 10pc”
9m sales figures 2022, 19 October 2022
The company seems to be in great shape.
It seems to us that the demand for unique products of the highest quality, craftsmanship and workmanship generally exceeds supply.
We believe that our brand is experiencing a moment of great positivity worldwide, and it seems to us that the spaces that we call Casa Cucinelli, created in the world’s major capitals, are also contributing to giving ever greater strength to our idea of hospitality and customer relations, in the desire to welcome customers and make them feel at home everywhere
9m sales figures 2022, 19 October 2022
I had to show you the Brunello Cucinelli cashmere cardigan pictured below. It’s nice, yeah. Well so it jolly well should be for £4,700 and yet these guys say demand exceeds supply. The rich really are different.

I am still too cautious to actually recommend buying the shares. Until the whole stock market picture looks more positive it just seems too dangerous to buy anything.

The ‘Quentinvest’ ETF still looks shaky
I call OGIG the Quentinvest ETF because its holdings are a roll call of shares that have been recommended in Quentinvest. It is also a chart classic. Accumulation, breakout, big rise, distribution, big fall and as yet no sign of a change of direction from down to up. There is huge support around $24 from all the trading between June 2018 and April 2020.
You could say that OGIG was a perfect lockdown ETF. Lockdown began and the shares took off. Lockdowns started ending seriously in early 2022 and the shares collapsed. What is going to drive the next period of rising prices. We are waiting to find out.
Look at their top holdings. They could hardly be more Quentinvest.

These are all really good businesses but at the moment there is a disconnect between business performance and share price performance. Until these start moving in step again shares are dangerous. There is also a fear that if we do need a recession to crush inflation this is going to impact demand, even for technology companies.


Incredible Chart/ Fundamentals for Advanced Micro Devices (AMD)

Who’s A Scaredy-Cat!

Stunning Micron Results Keep Memory Boom At Full Throttle