This is a chart of the Nasdaq 100 Technology Sector index going back 15 years. It is a long term chart plotted in three month vertical candles.Just for total clarity this means each candlestick covers a three months trading period so very long term. A buy signal is given when there is a golden cross, the shorter term blue line moving average moving up through the longer term red line moving average. The buy signals are marked in blue. In 15 years there have been five.
These types of buy signals work best with a share or index in a strong uptrend. The last buy signal was around April 2019, so over three and a half years ago. You could surmise that we are overdue for another one.
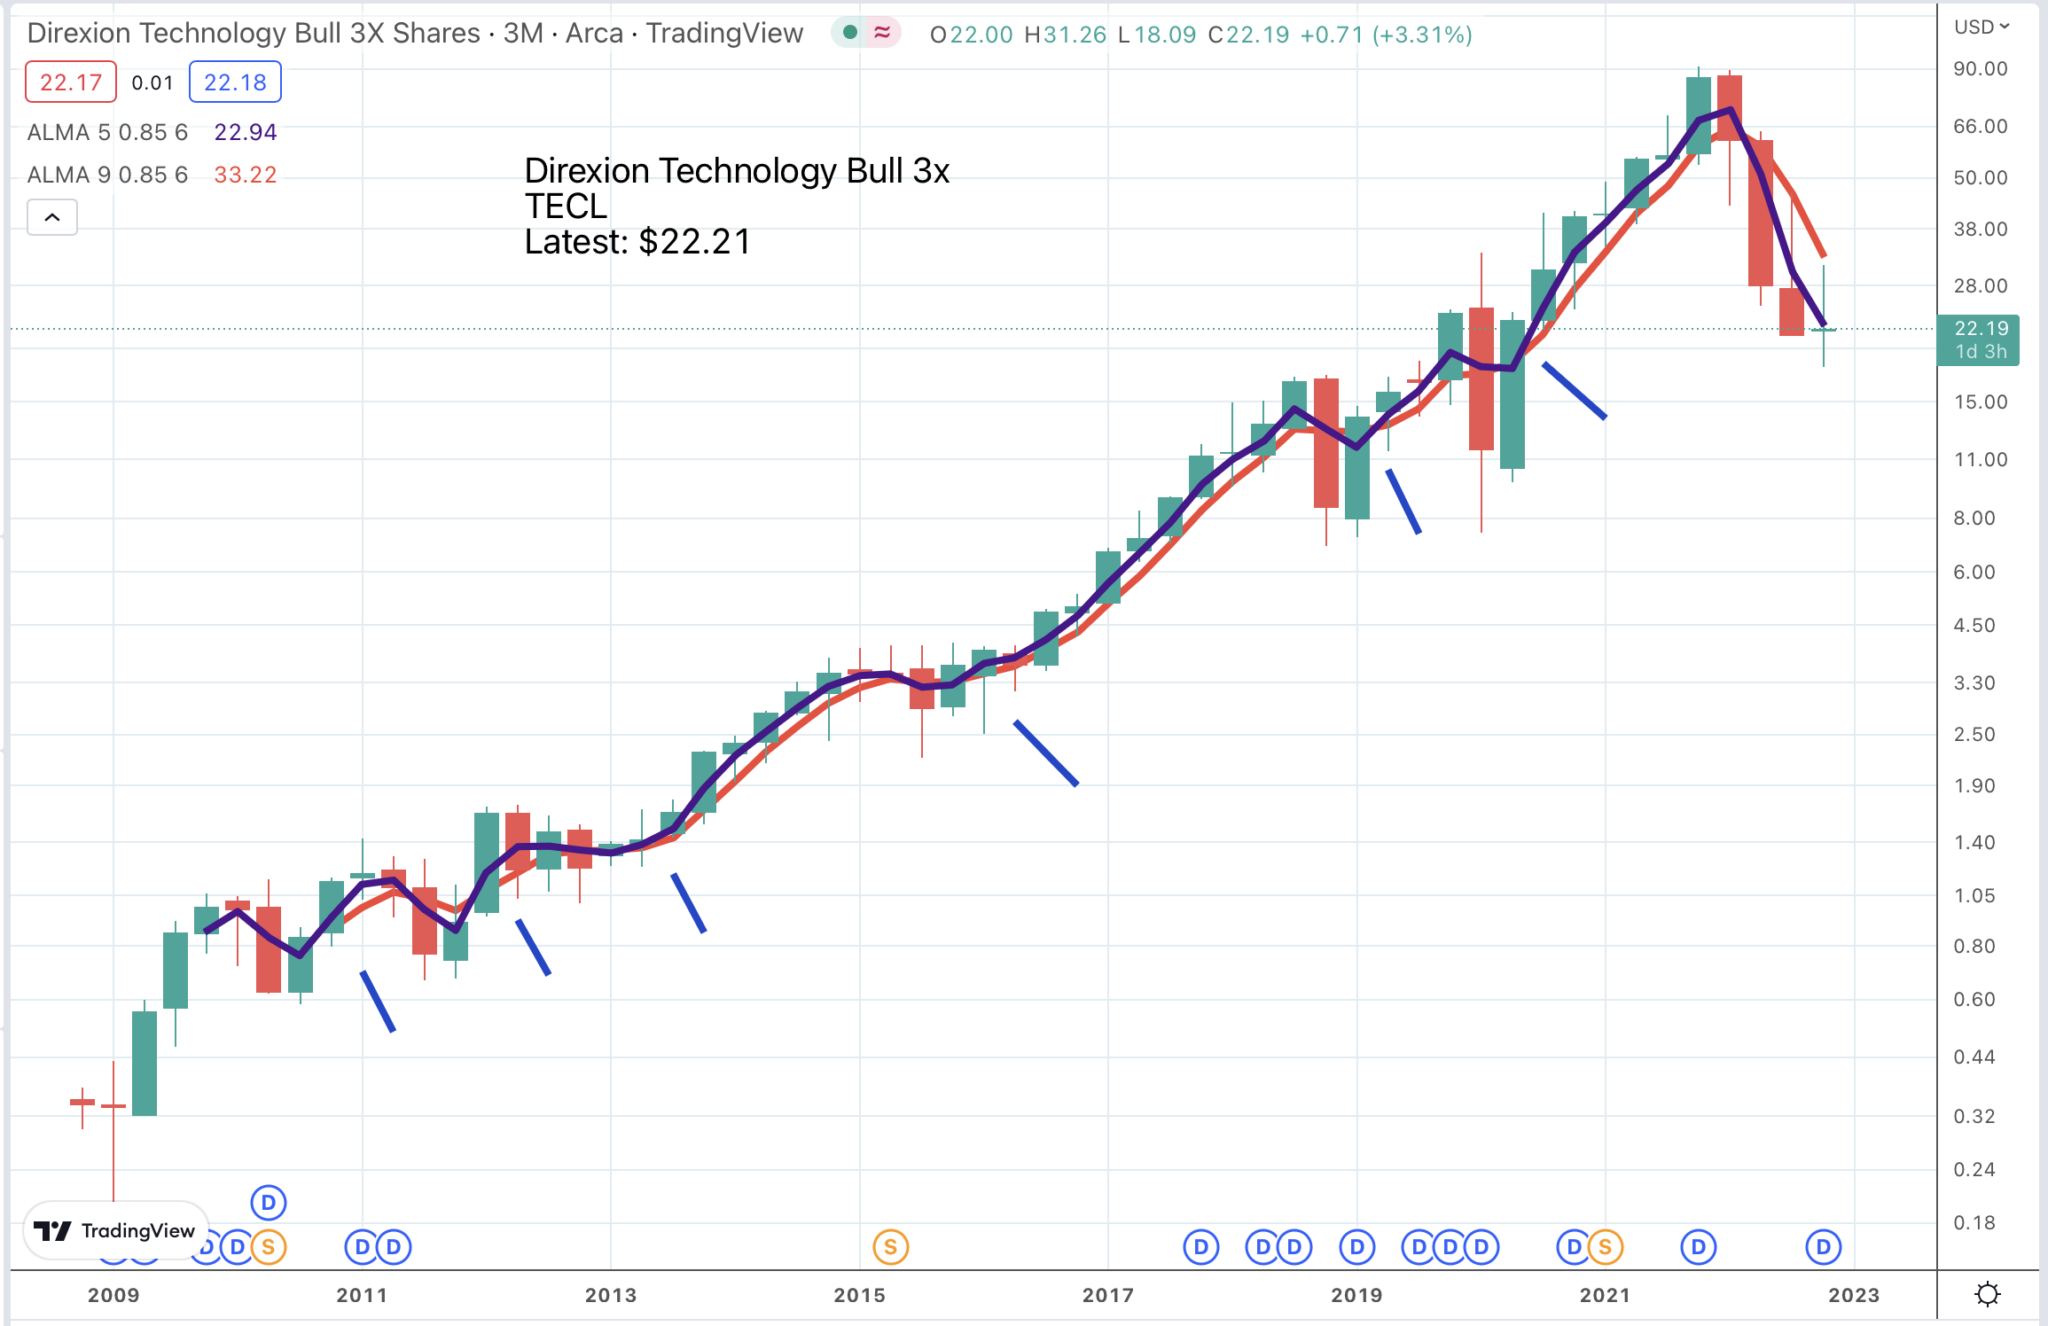
If and when we do get a buy signal from the Nasdaq Technology index this should be good news for TECL, a three times leveraged ETF that tracks technology shares. The ETF has its own buy signals, which have worked well on a similarly long time scale. Remember that four candles is a year so these signals can take a while to come good.
They seem to tie in well with the Coppock buy signals so make a useful addition to our armoury of indicators.
Below is a very long term chart of the Nasdaq Composite index. We are now enduring the fourth severe bear market since this index was created in 1973. The general picture is of a strongly rising secular trend.
This is no doubt a tribute to the vigour of American shareholder capitalism but there is something else going on. The chart is denominated in dollars, US greenbacks. This means that part of the reason for the relentlessly rising trend is depreciation of paper money. Since 1973 the index is up 187 times so over 50 years that equates to growth of around 11pc a year. Inflation has been around four per cent a year. If we assume real GDP growth of three per cent a year then corporate endeavours have added around four per cent a year.
None of these numbers seems very exceptional and with inflation running at a higher rate currently the secular rising trend in the index seems likely to continue. Many people also suspect that inflation is underestimated in the way it is calculated which means even less emphasis on real GDP growth and corporate inventiveness.
This is important because it creates a favourable backdrop for making money in the stock market. In a nutshell the buy signals discussed above are likely to work.
There may be another factor at work driving this trend and that is the ongoing technology revolution which seems likely to make technology shares more valuable relative to other types of shares. The conclusion seems to be that an expectation that in the long term this index will rise at a 10pc plus annual rate seems a reasonable one.
The further implication is that sharp falls in the index spring load it to appreciate at a faster than 10pc plus rate for a period at least.

Strategy
I don’t want you to think these chart techniques I am showing you are magic bullets. There is too much money at stake and too many clever people trying to make it for the stock market ever to be that predictable. But combine what we know with patience and discipline and I believe we can do very well.
Just as a reminder. What we are trying to do is buy and hold shares during periods when share prices are rising strongly and sell and step aside during periods of falling prices.
A further thing we are trying to do which will be discussed at more length in future issues is find the stars of the bull market and make sure that we invest in them.