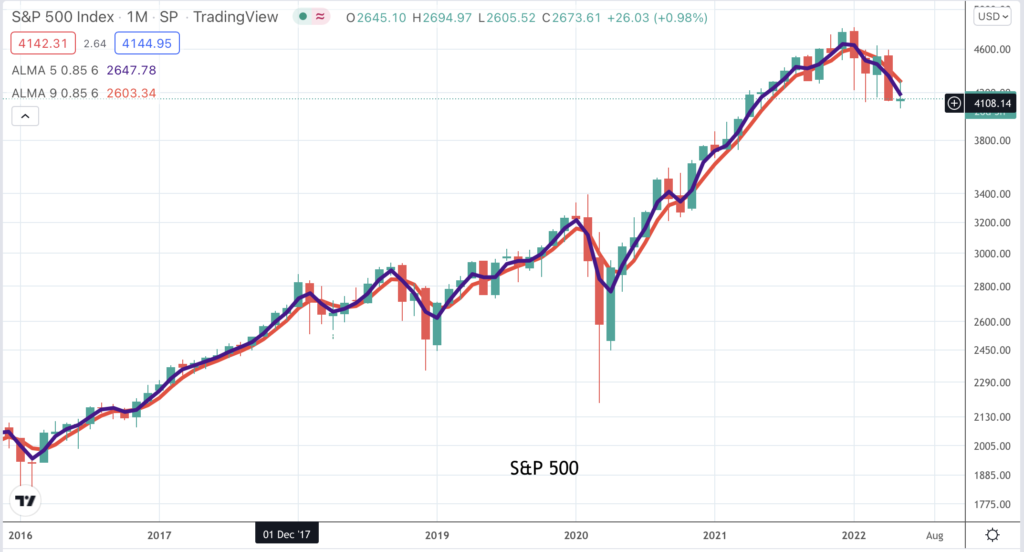
You don’t necessarily have to draw lots of lines on a chart to figure out what is going on; just look at the chart above and ask yourself what message it is giving. This is an important chart, the chart of the S&P 500 index. Do you see a message? I do and it is not a good one. The trading since July 2021 looks like a top area which is breaking down. It is not a massive top area but a reasonable expectation would be that whatever decline has already taken place is going to be doubled in coming months; that’s what top areas mean. Shares consolidate and then, if it is a bull market they break higher; if it is a bear market they break down.
The Coppock indicator for the S&P 500, like for many other indices and shares, is in free fall. It is not yet negative but the odds must be strong that it will become negative before this cycle is over. Longer term that is good news. Changes of direction by Coppock from negative are important and historically have been reliable indicators that a new bull market is beginning but we are not there yet. There could be more pain to come.
And we know why. The world is gripped by widespread shortages and rampant inflation and central banks need to make sure that inflation does not become entrenched. Even if it means recession they will need to raise interest rates and they cannot fight this one with massive quantitative easing, especially not while a war is raging between Russia and a Ukraine which is perceived by the West as fighting for all of us in the free world.
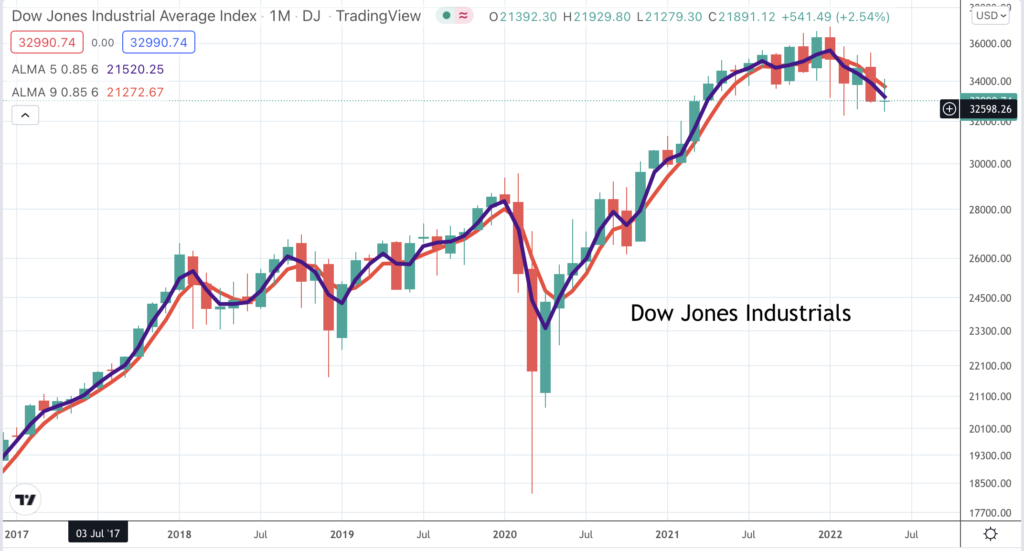
Another scary looking index is the Dow Jones. It may not be as important as it was but a breakdown from a major top area would still be alarming. It looks like a top area; the moving averages I use are declining in classic bearish fashion and the Coppock indicator is in free fall. If the index falls to 30,000, which is on the cards, is that going to look like bear market complete; maybe not since it has climbed from 18,500 in March 2020. There must be a fear that there will be worse to come. These charts are starting to look really ugly.
And here is one reason why. Amazon is a key bellwether stock for technology, ecommerce, the US and even the world economy. It shows a fierce breakdown from a top area. The pattern looks like what chartists call a line, which is a tight area of sideways trading. Breakdowns from lines can be significant. It may turn out that the extraordinary circumstances of Covid and the enforced lockdowns have encouraged Amazon to put too much capacity in place which could be painful if we are facing a period of recession.
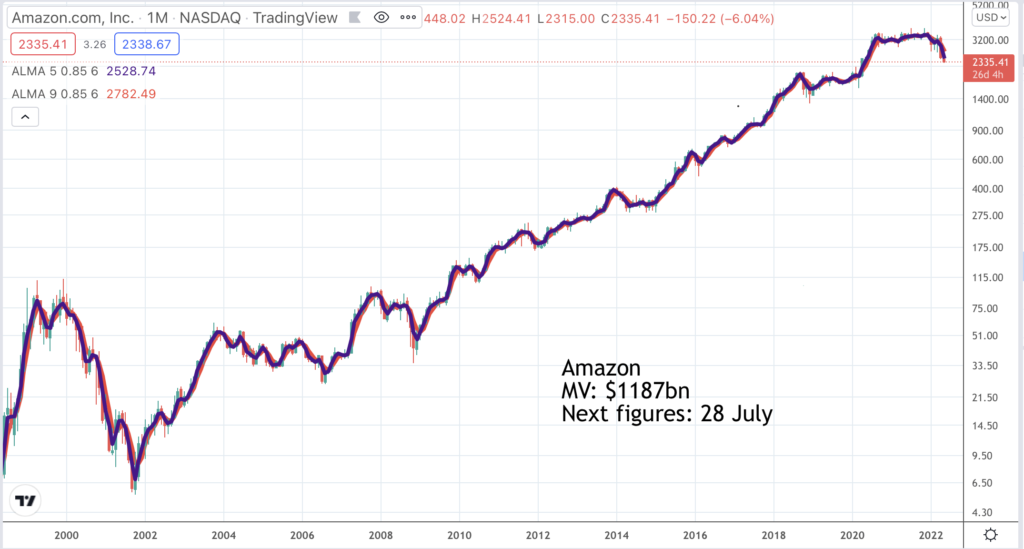
I guess giant companies like Alphabet, Microsoft and Apple have less of a problem since Apple is a massive outsourcer and Alphabet and Microsoft don’t need capacity in the same way as Amazon. Even so they are hardly recession proof. Their shares are heading lower and against a background of troubled times and rising interest rates they may decide to curtail their share buyback programmes that have been a major support for share prices.
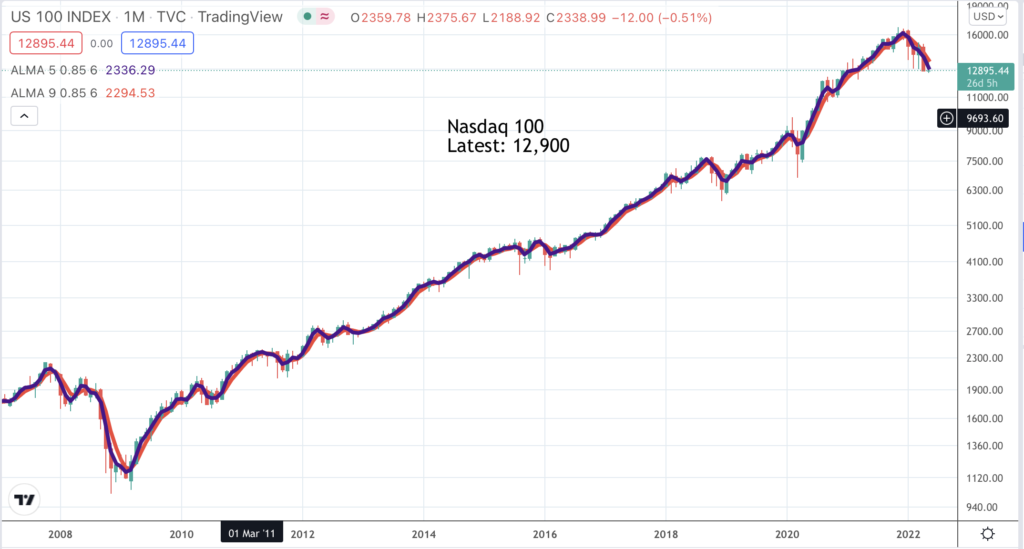
What about my favourite index, the Nasdaq 100, which does such a good job of reflecting the trend in the mega cap technology shares and technology shares in general. It is not breaking down from a large top area but it has certainly changed direction. They say you should never try to catch a falling knife in the stock market. The Nasdaq 100 has become a falling knife.
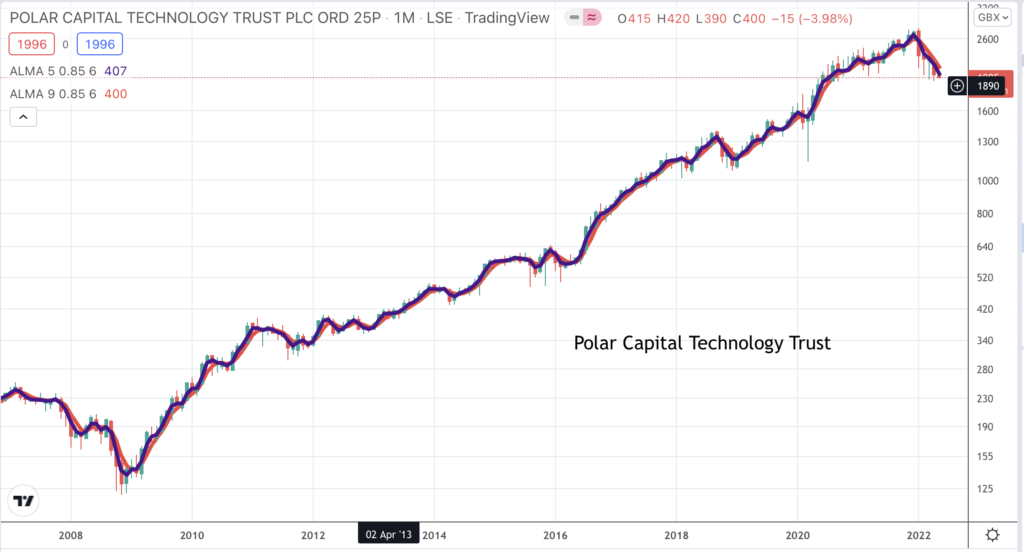
Another informative chart is the one for Polar Capital Technology Trust. It is well managed and invested in the world’s most exciting technology shares. What you can see on the chart is a line of support around 2000p. The price has bounced of this level six times in the last two years. A decisive break below the 2000p level for this classic bellwether stock would be an alarming development. The chart for Allianz Technology Trust (not shown) looks similar.
I am not going to show the chart again (having shown it recently) but the US stock market is supported by some $900bn of margin debt, a huge increase on the level seen in earlier years. A combination of falling stock markets and rising interest rates seems likely to lead to a significant unwinding of this debt and poses another threat to share prices.
It is a truism that stock markets bottom out at times of maximum gloom and there is plenty of gloom just now but as we know from Shakespeare’s famous tragedy, King Lear, things can always get worse, Lear thought he had hit bottom and then he heard the news of the death of his favourite daughter, Cordelia. It’s hard to measure gloom, which is why I prefer to wait for buy signals, which are less ambiguous.
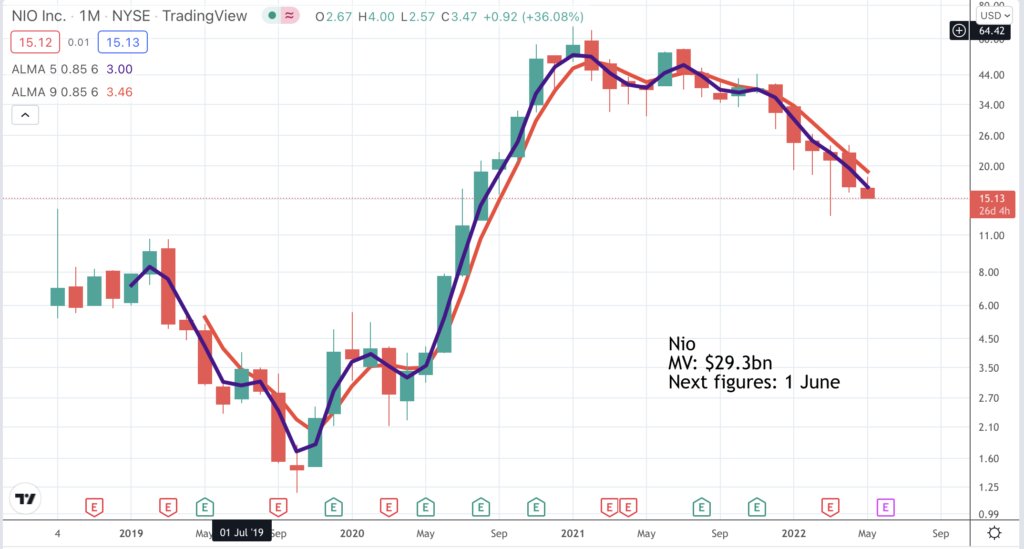
There is a danger that the experience of Chinese high growth, high technology shares has a message for the trend in similar US shares. Look at Nio, which is an exciting business. The shares are getting hammered. The valuation is demanding so there is no obvious support there. Pattern analysis has worked well for this stock. They broke up from a large consolidation in June 2020 and broke down in December 2021. On both occasions we are seeing big moves.

What to do in this market? Be cautious; build liquidity and don’t do anything until you see clear buy signals. We will alert as soon as we have them. We do not have them yet; quite the contrary; the charts remain threatening. When it comes to buy signals moving averages can be more ambiguous; Coppock is black and white. Also helpful will be the balance of bullish UBs v bearish UBs in the QV tables. For the moment it is time to watch and wait.
A particular danger with the US is that it is so easy to short sell stocks so you keep getting bouts of short covering which can trigger sharp but ephemeral rallies.