As investors, we mustn’t get blown every which way by an endlessly changing news flow. I think we all know that Trump is a turbulent guy. I’m rather in favour of beating the s**t out of the Ayotollahs, Hamas, Hezbollah and the Houthis, but it’s a minefield out there, to coin a phrase. Nobody knows how this will pan out.
Ditto with AI. An incredible force has been unleashed on the world with incalculable effects. It is already causing havoc in the stock market.
Everybody has their opinion on what is happening and what might happen. This is all good fun, but nobody has a crystal ball, so nobody knows what is coming, and that includes all the self-proclaimed experts, the guys who forecast the last five bear markets and even the guys with billions in the bank. The future is a mystery.
Here is an example. I will give you a billion dollars if you can tell me whether the Palantir share price will be higher or lower in a week. If you lose, you must jump off a cliff. Will you take the bet? Only if you are one hell of a gambler, because neither of us knows the answer to that question.
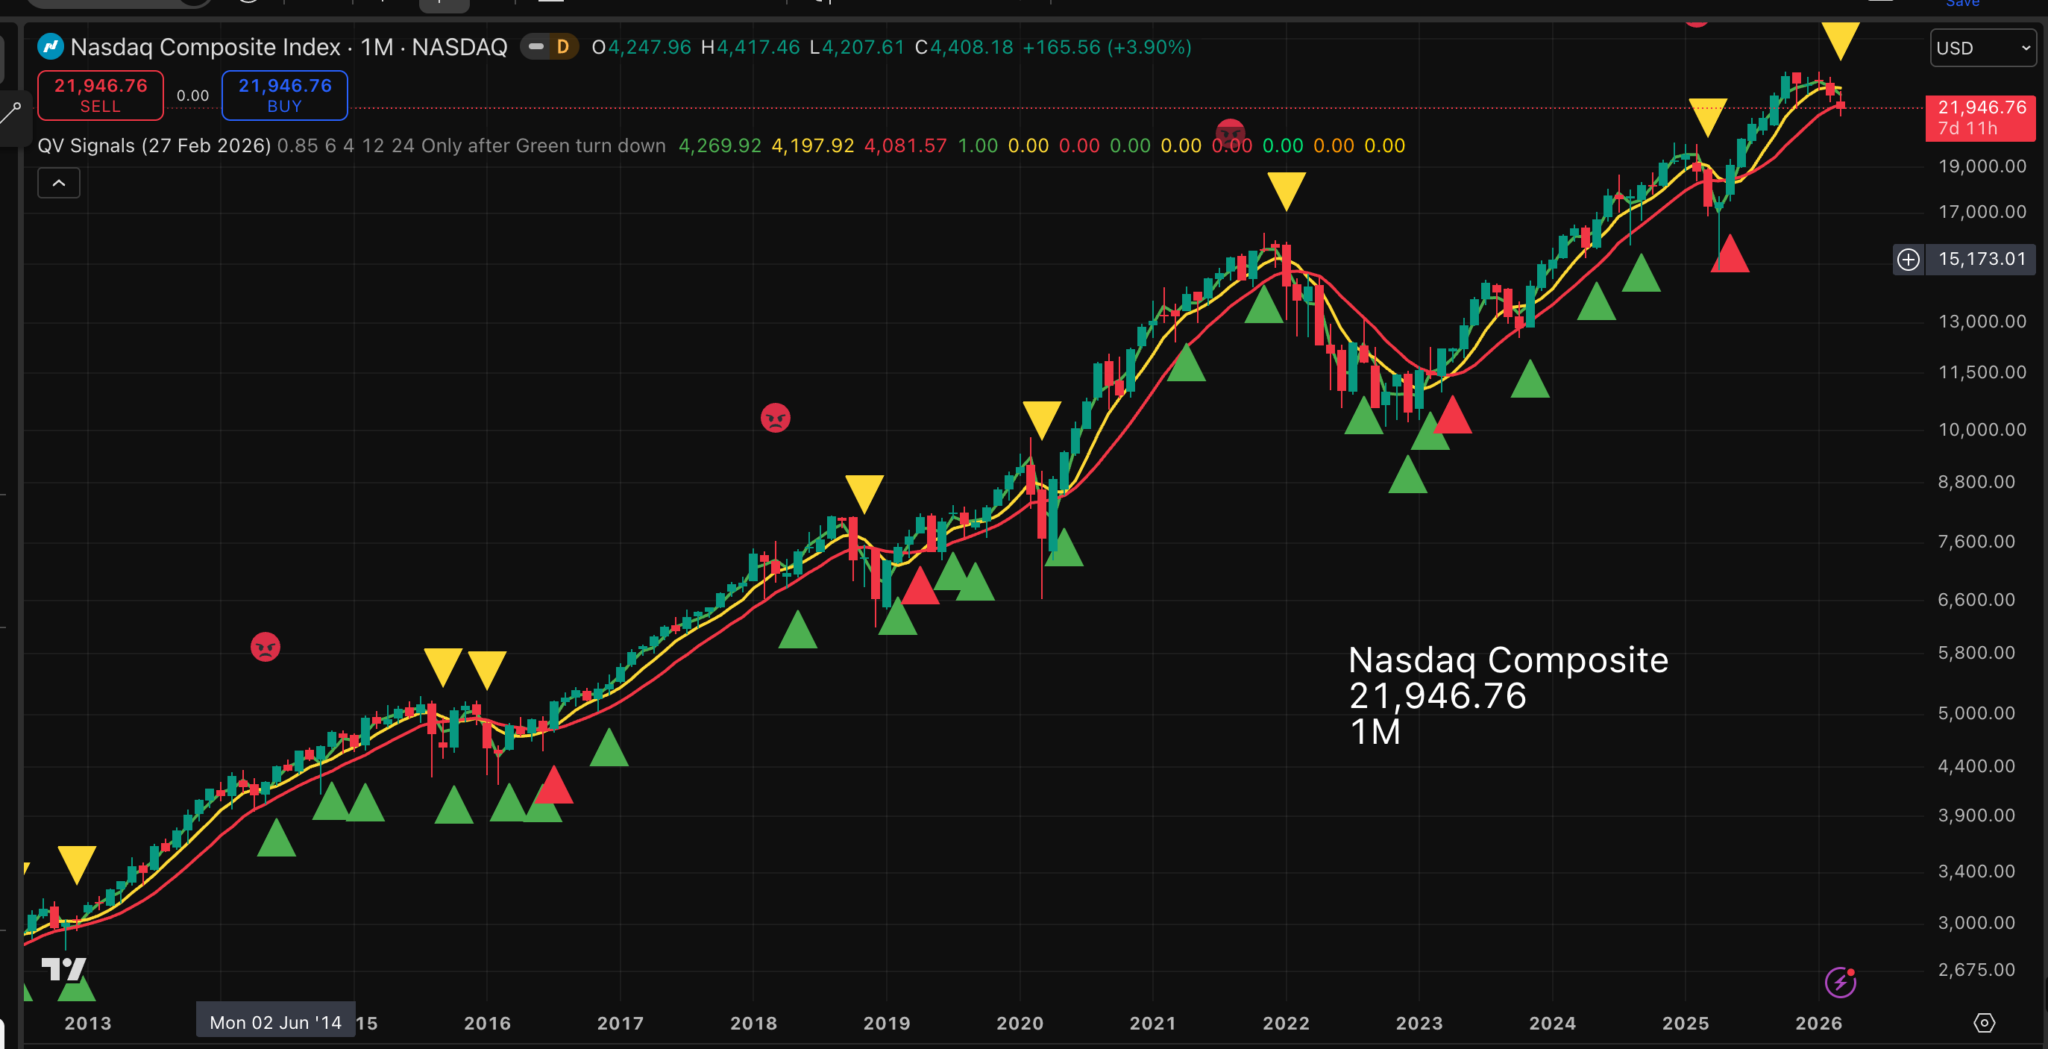
Charts don’t predict the future, nothing does, though I sometimes think that Coppock comes close, but they give us a clue by telling us what is happening to momentum now. The Nasdaq Composite index (chart above), like other key U.S. indices, is losing momentum as indicated by the yellow line moving average sell signal.
The message is that this is no time to set up a bullish trade in the Nasdaq Composite index, and caution is warranted for its constituents.
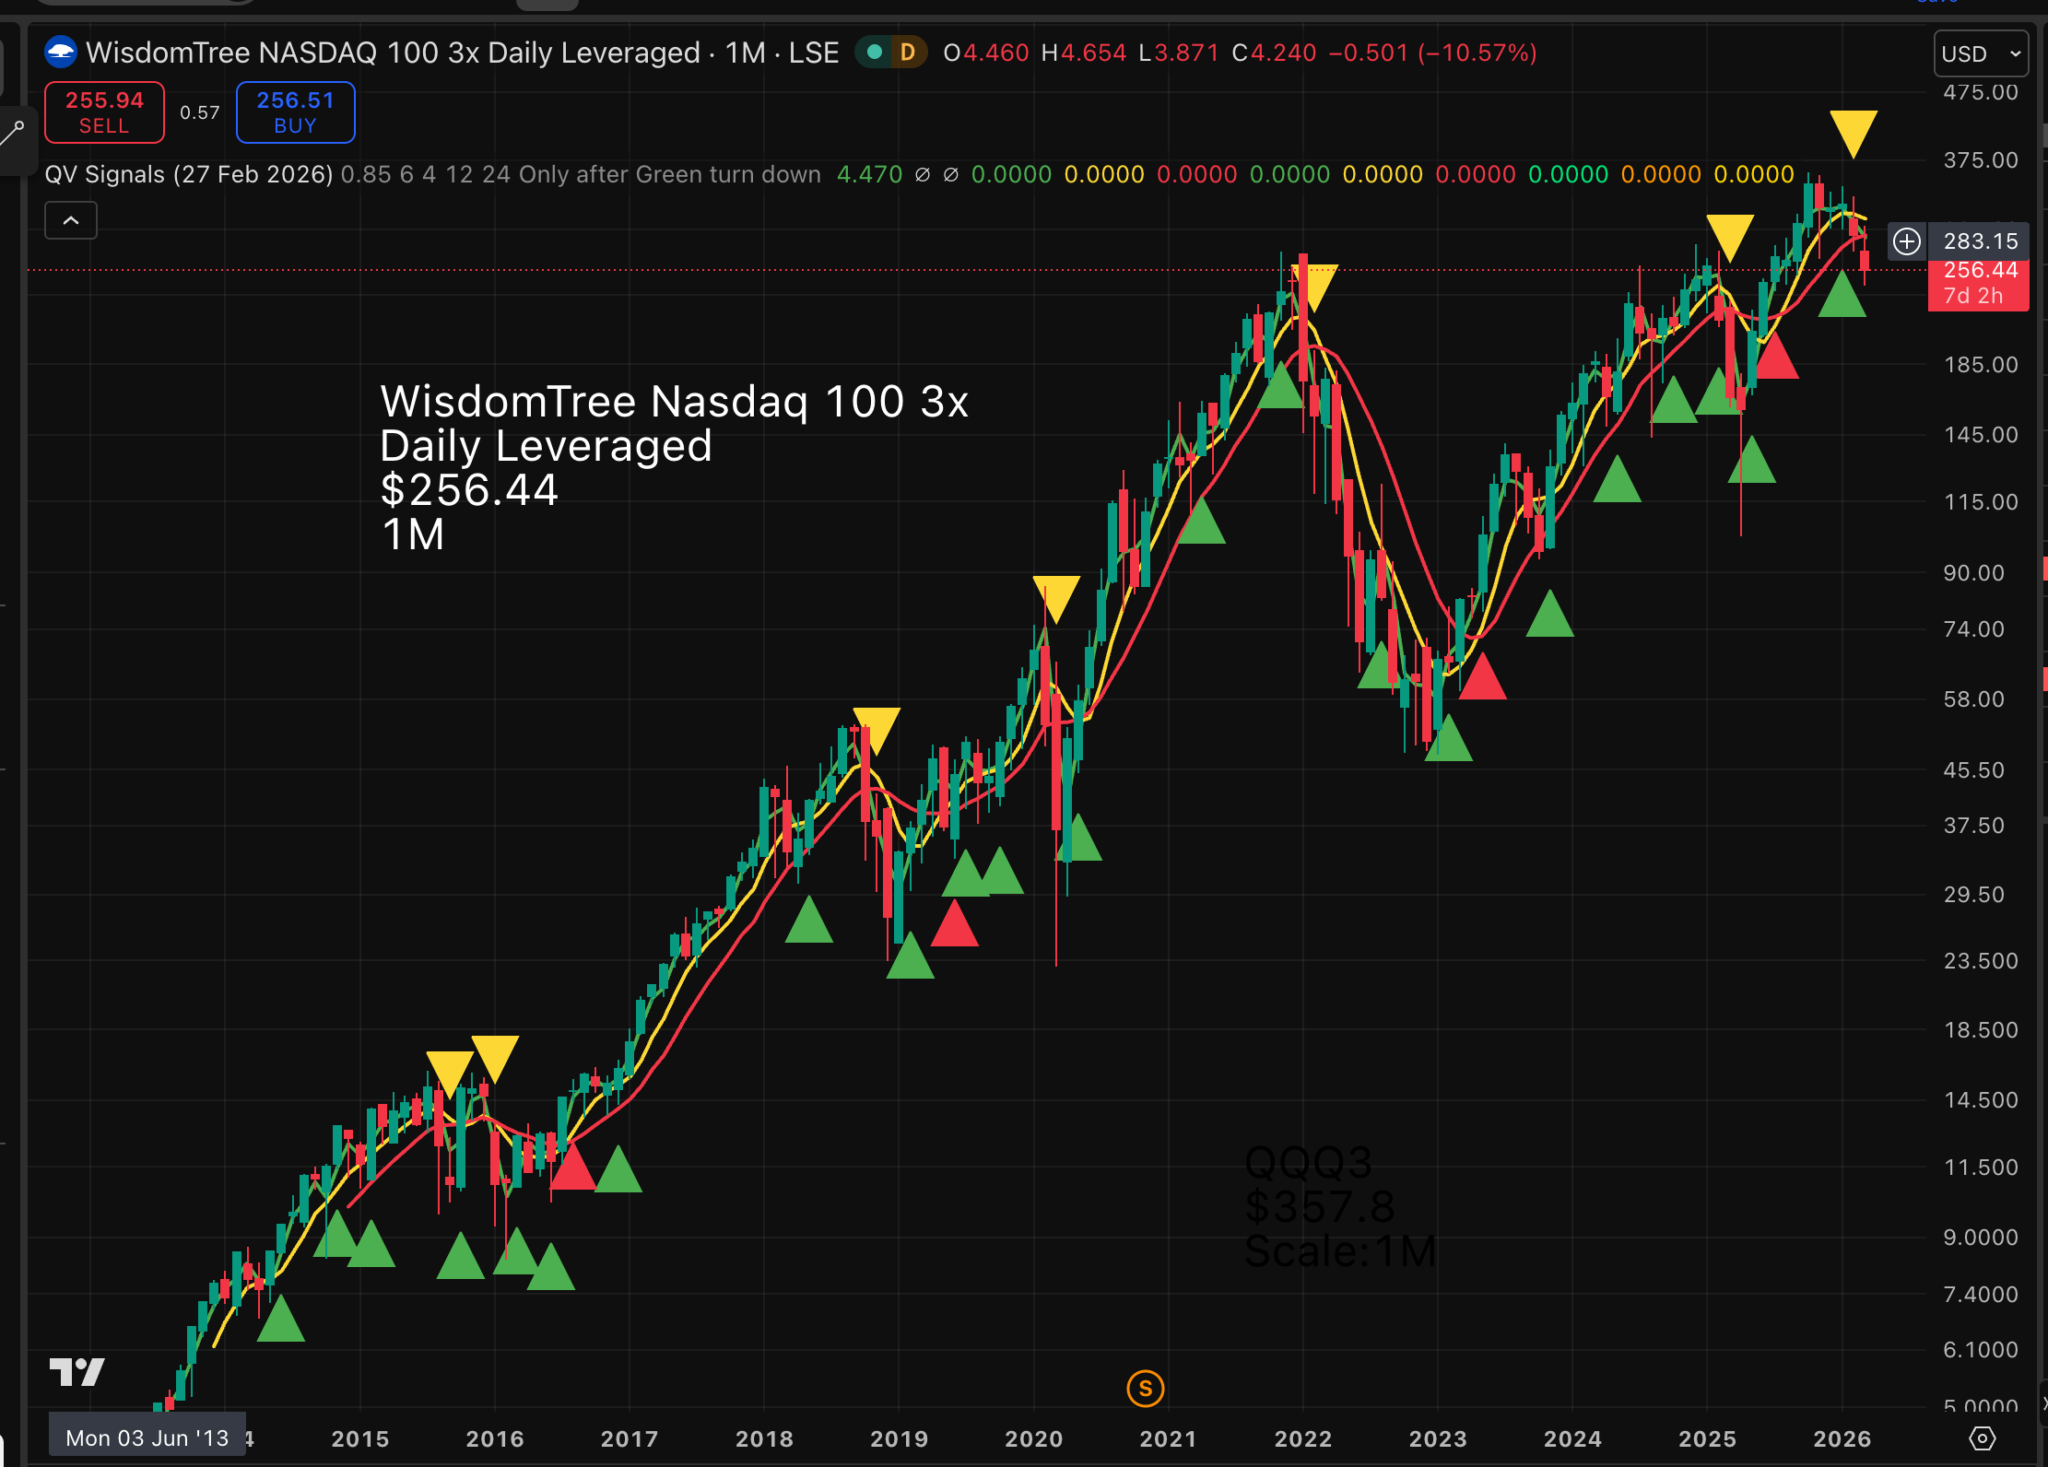
The message is similar for QQQ3, the leveraged fund tracking the Nasdaq 100. As we can see, red-line buy signals have been important and yellow-line sell signals should make us cautious.
If you study the chart closely, you will see there are time lags between share price movements and signals. The positioning of the triangles makes it look easier to make winning trades than is the case in practice. One way of improving on this is to use trend lines. These can be used in tandem with the yellow and red signals to enable us to act nearer to the tops and bottoms of a move. Trend line breaks can give us crucial clues.
This makes the whole process more of a singer, not the song experience. We need somebody, me?, with long experience of reading charts to interpret the message. It seems there is no automatic pilot that can make us tons of money while we sip whisky in our home sauna. We need to engage our brains with the problem.
Ideally, the trend line break helps us identify the precise moment when a yellow-line sell signal is triggered. Something similar happens with the red-line signals, helping us set up profitable trades.
Is Trump mad or brilliant? With one hand, he rains bombs on his adversaries; with another, he offers negotiations. No wonder investors and opponents find it all very confusing. He seems to be doing this without having to bother about all the usual checks and balances in US politics. I have never seen such an imperial presidency. Is this worrying? Most of his adversaries have no checks and balances, and Rome did surprisingly well under such exotic figures as Nero.
We have a king, but neither he nor our prime minister has anything like the power that Emperor Trump is demonstrating in the USA.
At some point, if US stock markets continue to decline, we will need to study Coppock for its infallible clues to when bear markets end, but not yet. What is most noticeable is that rallies, whether of the indices or important individual stocks, fizzle out soon after they have begun.
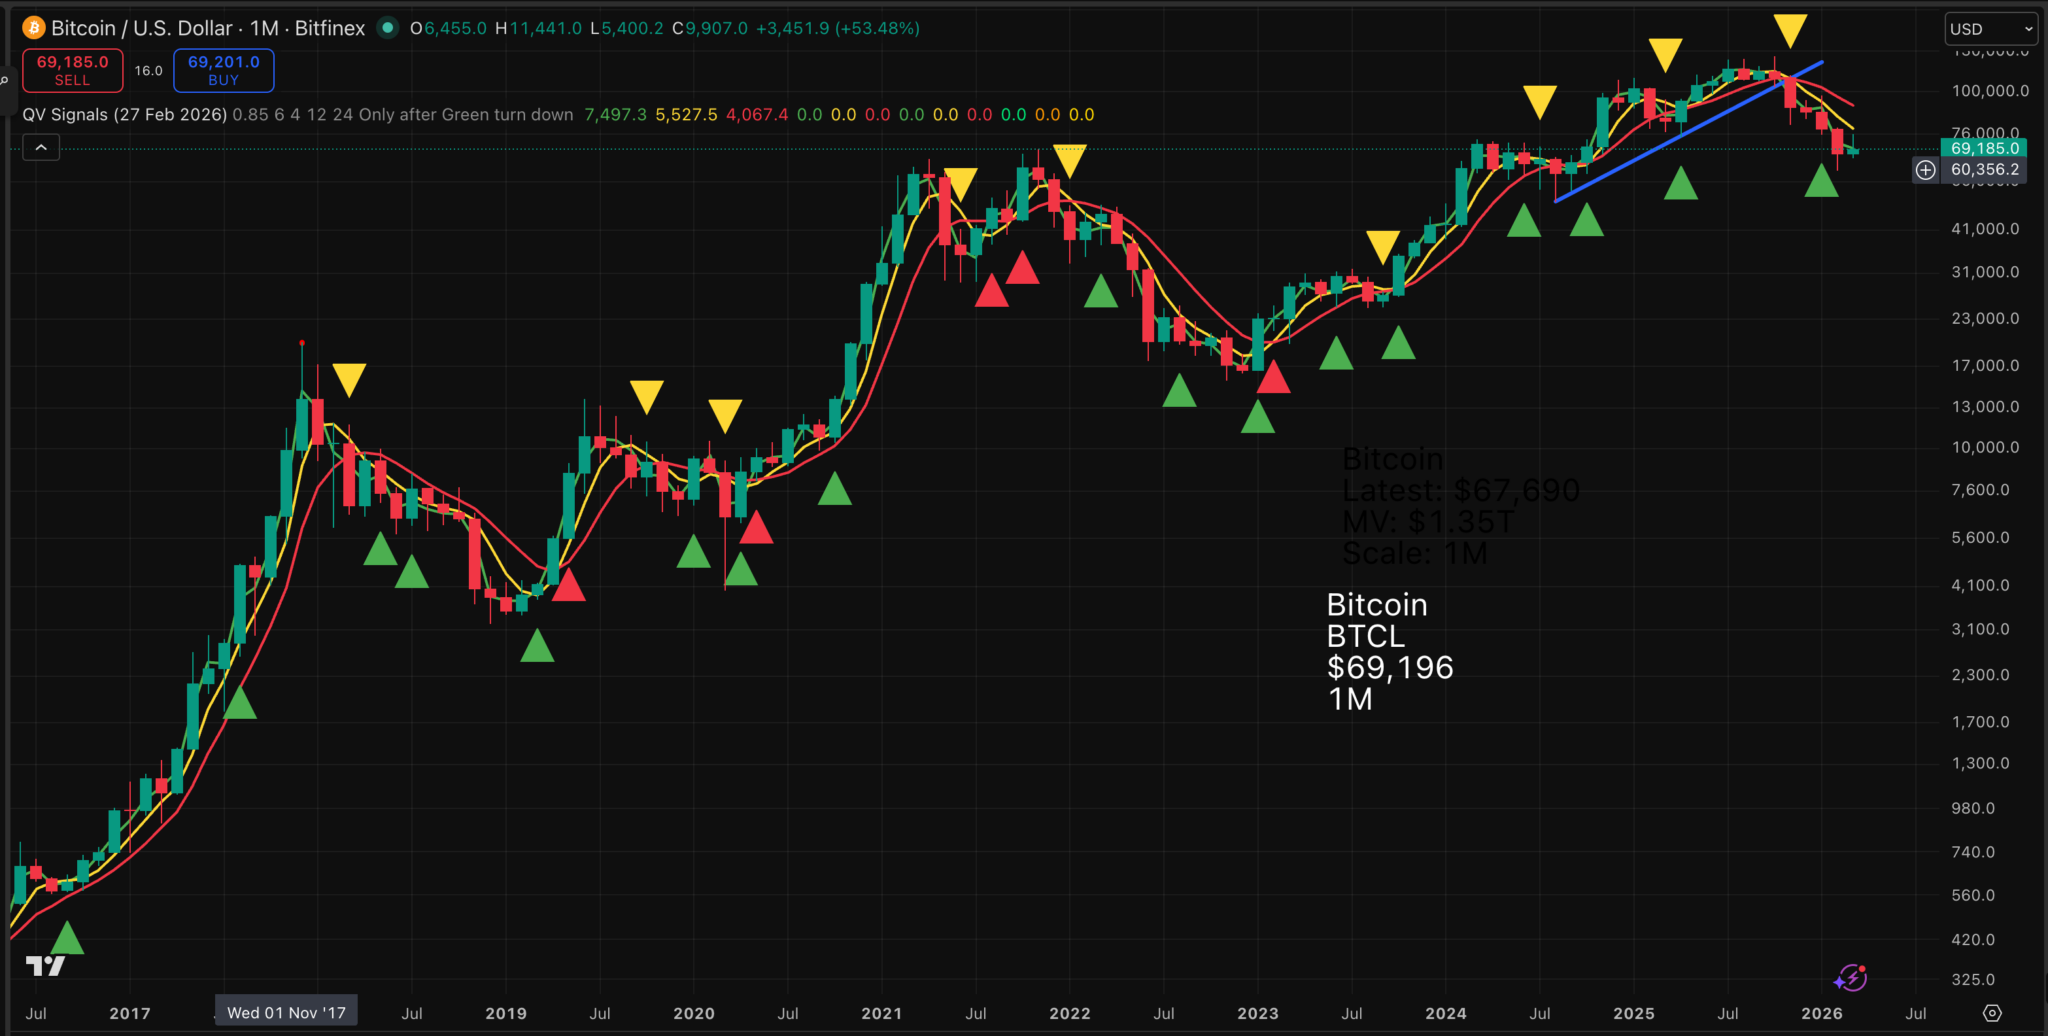
Bitcoin paints a vivid picture of how the charts are pointing down with all the moving averages declining. We have just had a rally from an oversold position, but nothing to suggest a change of trend. This chart could plunge at any moment. The trend line break highlights where Bitcoin became a sell.
Margin debt in March 2000, before a savage bear market, was $136bn. It is presently around $1.28 trillion. These guys are potential forced sellers if the US stock market turns ugly. There is something of an on the brink feeling about stock markets presently, with bearish charts and sell signals all over the place.
10-year bond yields are jumping sharply, in the US and in the UK, where they are around five per cent. Rising bond yields are like kryptonite for the stock market.
The analyst community is still bullish on stocks, but these guys are always behind the curve.
Strategy – Be Afraid, Be Very Afraid
My gut feeling is that the US stock markets are vulnerable. Any unexpected shock could trigger a rush for the exits. I think subscribers should take precautionary action. Trying to sell into a collapsing stock market is a nightmare.
Years of rising markets have made investors complacent. Peak optimism was reached in October 2025 and has been seeping away ever since. I sometimes feel that Nvidia is holding this market up almost single-handedly. If their share price breaks, it could get scary. For once, I am not sure I envy Jensen Huang unless somehow he can pull a rabbit out of the hat.
The shares have strong support around $170, which is becoming a key level. What we are seeing is a classic bunching of the moving averages, which is traditionally the precursor to a big move. The falling yellow line suggests that this move could be down.
NVIDIA has incredible fundamentals, but that is reflected in the price. Nvidia has a market value bigger than the GDP (gross domestic product) of the UK. That is a staggering statistic. Demand for data centres has been raging almost out of control for years. If it falters, watch out, and some of the hyper scalers, like Microsoft and Meta Platforms, have weak charts with the red line falling. If investors start to lose confidence in their strategy, this could feed through to falling data centre demand.
This is all hypothetical, but booming demand is priced into the market. Anything else could be a shock. As I keep saying, opinions are 10 a penny. The facts are what matter, and the facts are that we are seeing a steady deterioration on the charts. It is making me nervous.
In the last couple of days, I have had frequent sightings of a Waymo Jaguar, a car using Google’s self-driving technology, moving around the streets of Kensington and even further afield in the Harrow Road. The future is coming but it may be a while yet before we are jumping in and out of these cars. There was a driver on board but I guess he was not doing anything.