Like many people who use technical analysis I use two moving averages on my charts and when these cross I derive signals. When the averages cross in an upwards direction that is a golden cross buy signal. When the averages cross in a downward direction that is a dead cross sell signal.
I have noticed two things on the charts I use. First, that on 3m candlestick charts, where each candlestick represents three months of price action in a vertical bar, there is a marked tendency for 3m golden crosses to coincide with Coppock buy signals. Secondly, I have noticed that if I use only changes in direction in the shorter moving average to generate signals they coincide almost exactly with the Coppock signals and work as well as the crosses but slightly sooner.
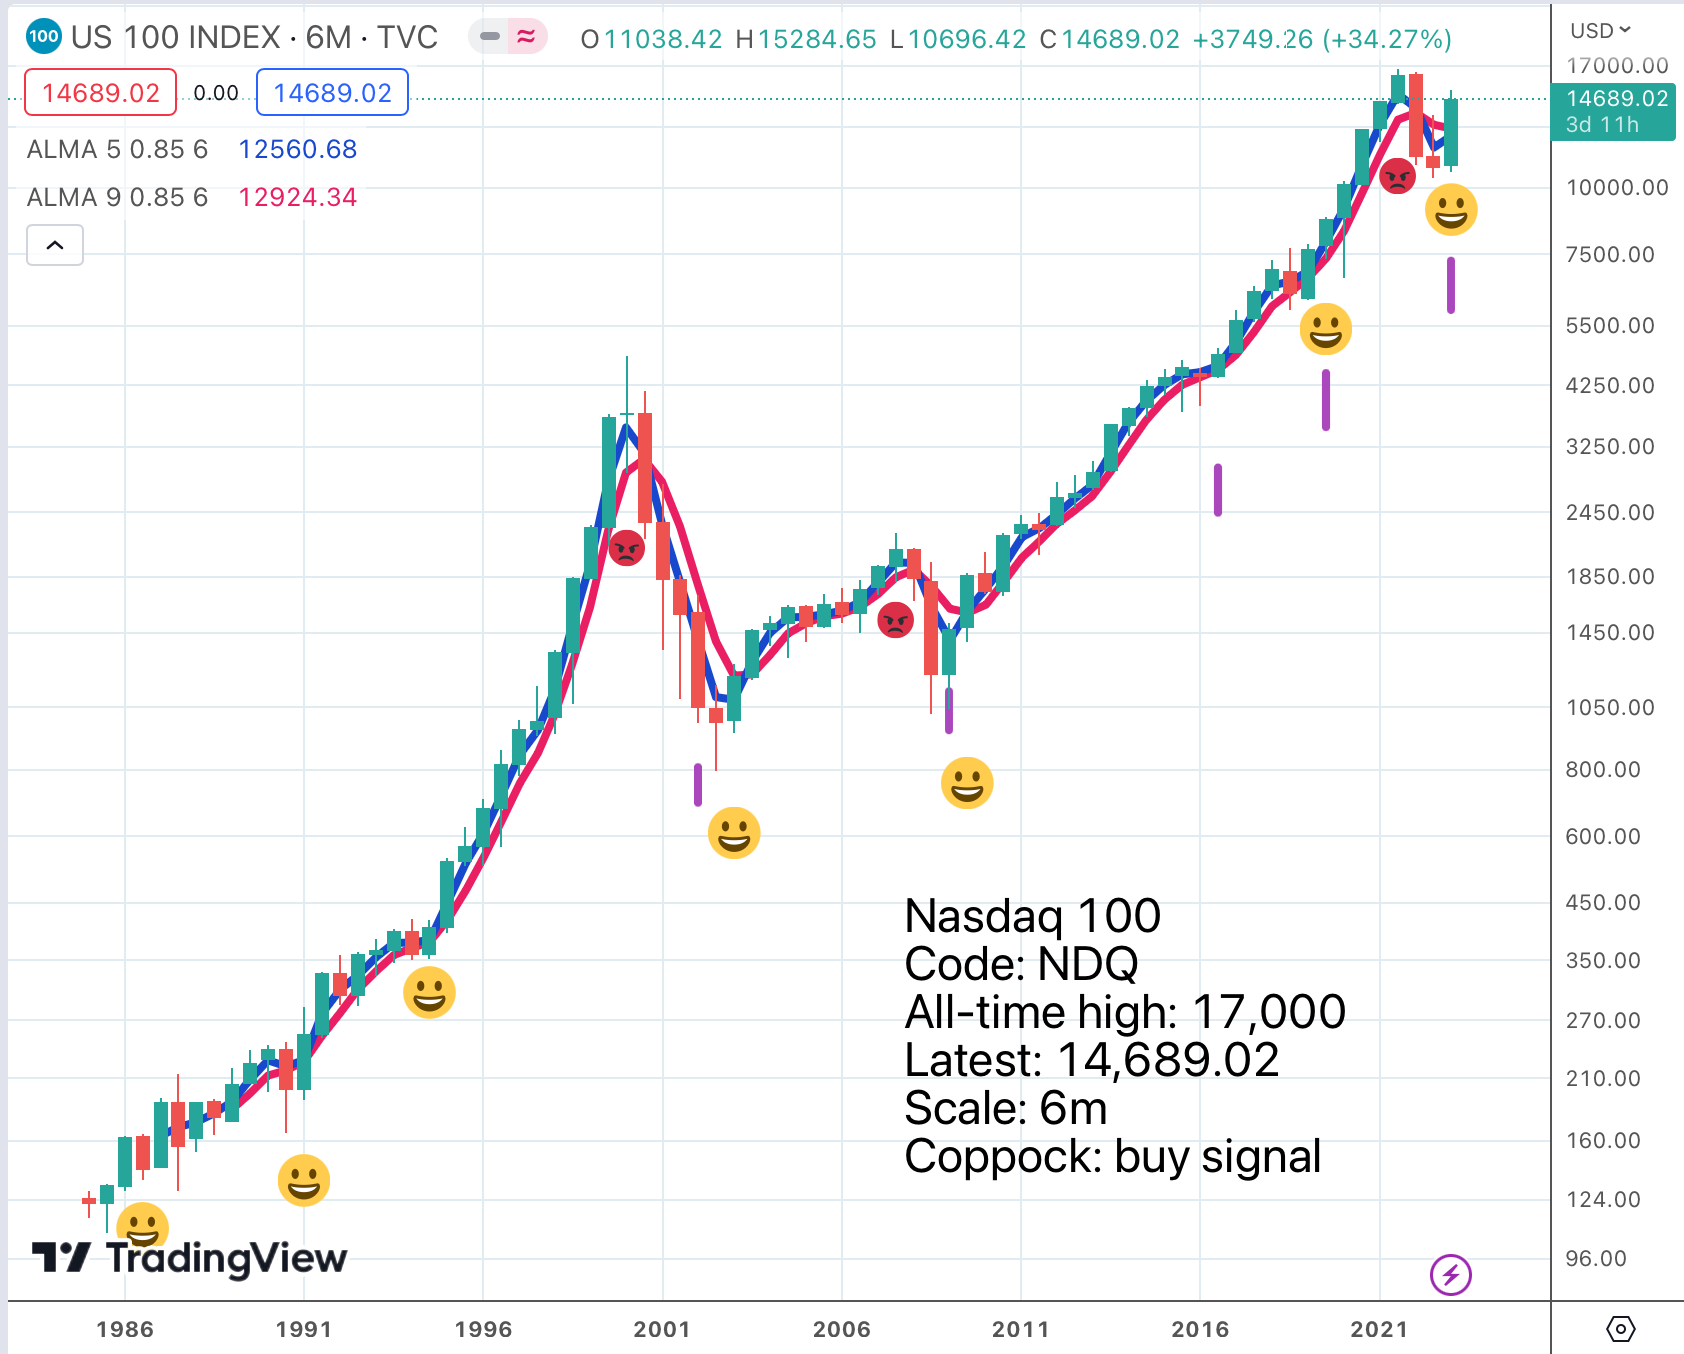
My moving averages are coloured red for the longer nine month average and blue for the shorter five month average; that is why I say it is all in the blue.
Table of Contents
Red Frownie on the Nasdaq 100 Means Sell Everything (When We Get One)
This is a chart of the Nasdaq 100 index annotated with my signals. As long as the last thing we saw was a golden smiley we are in buy and hold mode. When we see a red frownie, we sell everything and wait for the next golden smiley. I have moved the golden smileys slightly so they are triggered when the blue moving average turns higher. There is a strong tendency for these golden smileys to coincide with Coppock buy signals.
This is interesting because I have a technique for projecting the numbers forward to predict when Coppock is going to turn higher. For example, in 2022, I said that I expected a Coppock buy signal for the Nasdaq 100 in March 2023 and that signal was duly given and around the same time the blue moving average changed direction and headed higher.
Since then more and more shares have been doing well and as subscribers know I have become very excited about Nvidia. The more I learn about what is happening the more excited I become.
This is not the case with value investors who think that Nvidia is overbought, which it is and overvalued which is much more debatable. The problem is that there is nothing scientific about saying a share is overvalued because it involves crucial assumptions about the future but we don’t know what the future holds.
Did anyone see generative AI coming 10 years ago? Not me but Nvidia did which is why the business and the shares are doing so well now. Jensen Huang is a very clever man working with some very clever people and they are way ahead of the game compared to us lesser mortals.
I listened to a recent interview with Jensen Huang. The questions were friendly but he did make a point which resonated with me. He said that throughout the Covid period including in 2022, the company was going through a vintage period of technological progress with fabulous innovations coming thick and fast.
Investors were not paying attention, partly because Jensen Huang is always talking world conquest but also because supply and inventory issues meant that Nvidia’s financial results in this period were not always great. In the year to January 2023 sales flatlined and profits more than halved. Since this was happening during a sharp stock market correction the shares plummeted from a peak $347 to $102.
Now think back to what Jensen Huang said about the company making great technological progress during this period and so setting the business up for the sales explosion that is now taking place.
The morale of the tale is that Nvidia shares are not so much too high and overbought now but were too low and oversold in October 2022 and that is why they have moved higher so dramatically.
Strategy – Buy Nvidia
I think any strategy will work with Nvidia. I have such a good feeling about this company and their shares. They are so obviously one of the world’s greatest technology businesses. The energy and innovation coming out of them is incredible and what a charismatic, bundle of energy, cheer leader they have in Jensen Huang. Keep the kryptonite away and he expects to keep going for years yet.
Whatever you do will work with this one. Buy when they go up, buy when they go down, buy when they go sideways, buy some more every month. The only strategy which will not work is not to buy at all; that would be a big mistake.
Seeking Alpha’s Bias to Bearishness
This is not the impression (bullishness about Nvidia) I get from Seeking Alpha. I read a question recently from a subscriber to their service asking why all the Seeking Alpha commentators were so bearish of Tesla. Why indeed? There was no reply. I notice that a similar phenomenon is happening with Nvidia where most but not all of the Seeking Alpha commentators think the shares are overvalued.
By their metrics they are probably right but that is not the point. It is a bit like when the Austrian emperor said he quite liked one of Mozart’s operas but there were ‘too many notes’. He probably had a point but history may think that he rather missed the big picture.
It is the same with Nvidia. The things that make the company amazing and the shares a buy are the intangibles, the magic of which this company is so full, the pivotal role it is playing in the future of Homo Sapiens on this planet, the sheer innovative energy; that is what you are buying when you buy the shares.
And this magic will express itself in news flow as much as numbers. The company has just announced an agreement with Snowflake, the data business which will help Snowflake’s customers to apply the power of generative AI to their proprietary data. There is going to be an endless stream of announcements like that from Nvidia.
I also learned something important from the latest interview with Jensen Huang. Nvidia didn’t create GPUs for gaming so much as apply its unique technology to making GPUs for gaming. What is now happening is that the whole company has been positioned to apply its technology, both hardware and software, to powering up and enabling generative AI.
One of the first applications is to reinvent the world’s trillion dollars of data centres which are no longer fit for purpose. This is the immediate reason why demand is exploding for Nvidia’s hardware and software.
Analysts have been asking if this is a one-off spike in demand. At Nvidia they don’t think so; rather they think that after a decade of leading up to this moment demand is finally taking off.
Generative AI and the physical world
When asked what was going to be the next big thing for Nvidia and for technology in general Huang said it was when generative AI stopped being purely digital and began to inter-relate with the physical world. I am still not quite sure what he meant by that (AI in factories, cars, robots, AI reinventing the advertising industry, stuff like that) but he said this is a multi-trillion dollar opportunity, will change the world out of all recognition and would require massive innovation to make it happen.
Is this exciting? Is it ever.
Share Recommendations
Nvidia NVDA. Buy @ $406

As subscribers will surely realise I feel much the same about QQQ3, making Nvidia and QQQ3 my two must-own shares. In fact, if all you ever do is add to your holdings in these two shares, I would expect you to do incredibly well over time.
This reflects another growing belief I have. There are at least 100,000 shares out there and many of them are in companies which are doing well. There are many 3G shares. There are even many 3G shares with ‘something magic’ and ‘something new’ but most of us cannot buy them all.
Plugging Into the Exponential Technology Revolution
I am starting to think that the most important shares for us to buy are those which plug directly into the technology revolution. The companies which are creating the modern world. QQQ3 is a member of this group because its performance directly reflects the performance of the world’s most exciting technology companies.
Think about it. Many observers believe that the technology revolution is going exponential; that has to be fantastic news for the companies making it happen.
If we look outside the world of high technology at companies like fast casual dining specialist, Chipotle Mexican Grill, beauty products group, E.L.F. Beauty, luxury goods group Hermes and equipment rental specialist, Ashtead, they need to be really special to divert our attention from high tech.

More Share Recommendations
Wisdomtree Nasdaq 100 3x Daily Leveraged. Buy @ $113.30
Chipotle Mexican Grill CMG. Buy @ $2029.50
E.L.F. Beauty. ELF. Buy @ $107.41
Hermes RMS. Buy @ Eu1900
Ashtead Group AHT. Buy @ 5288p