
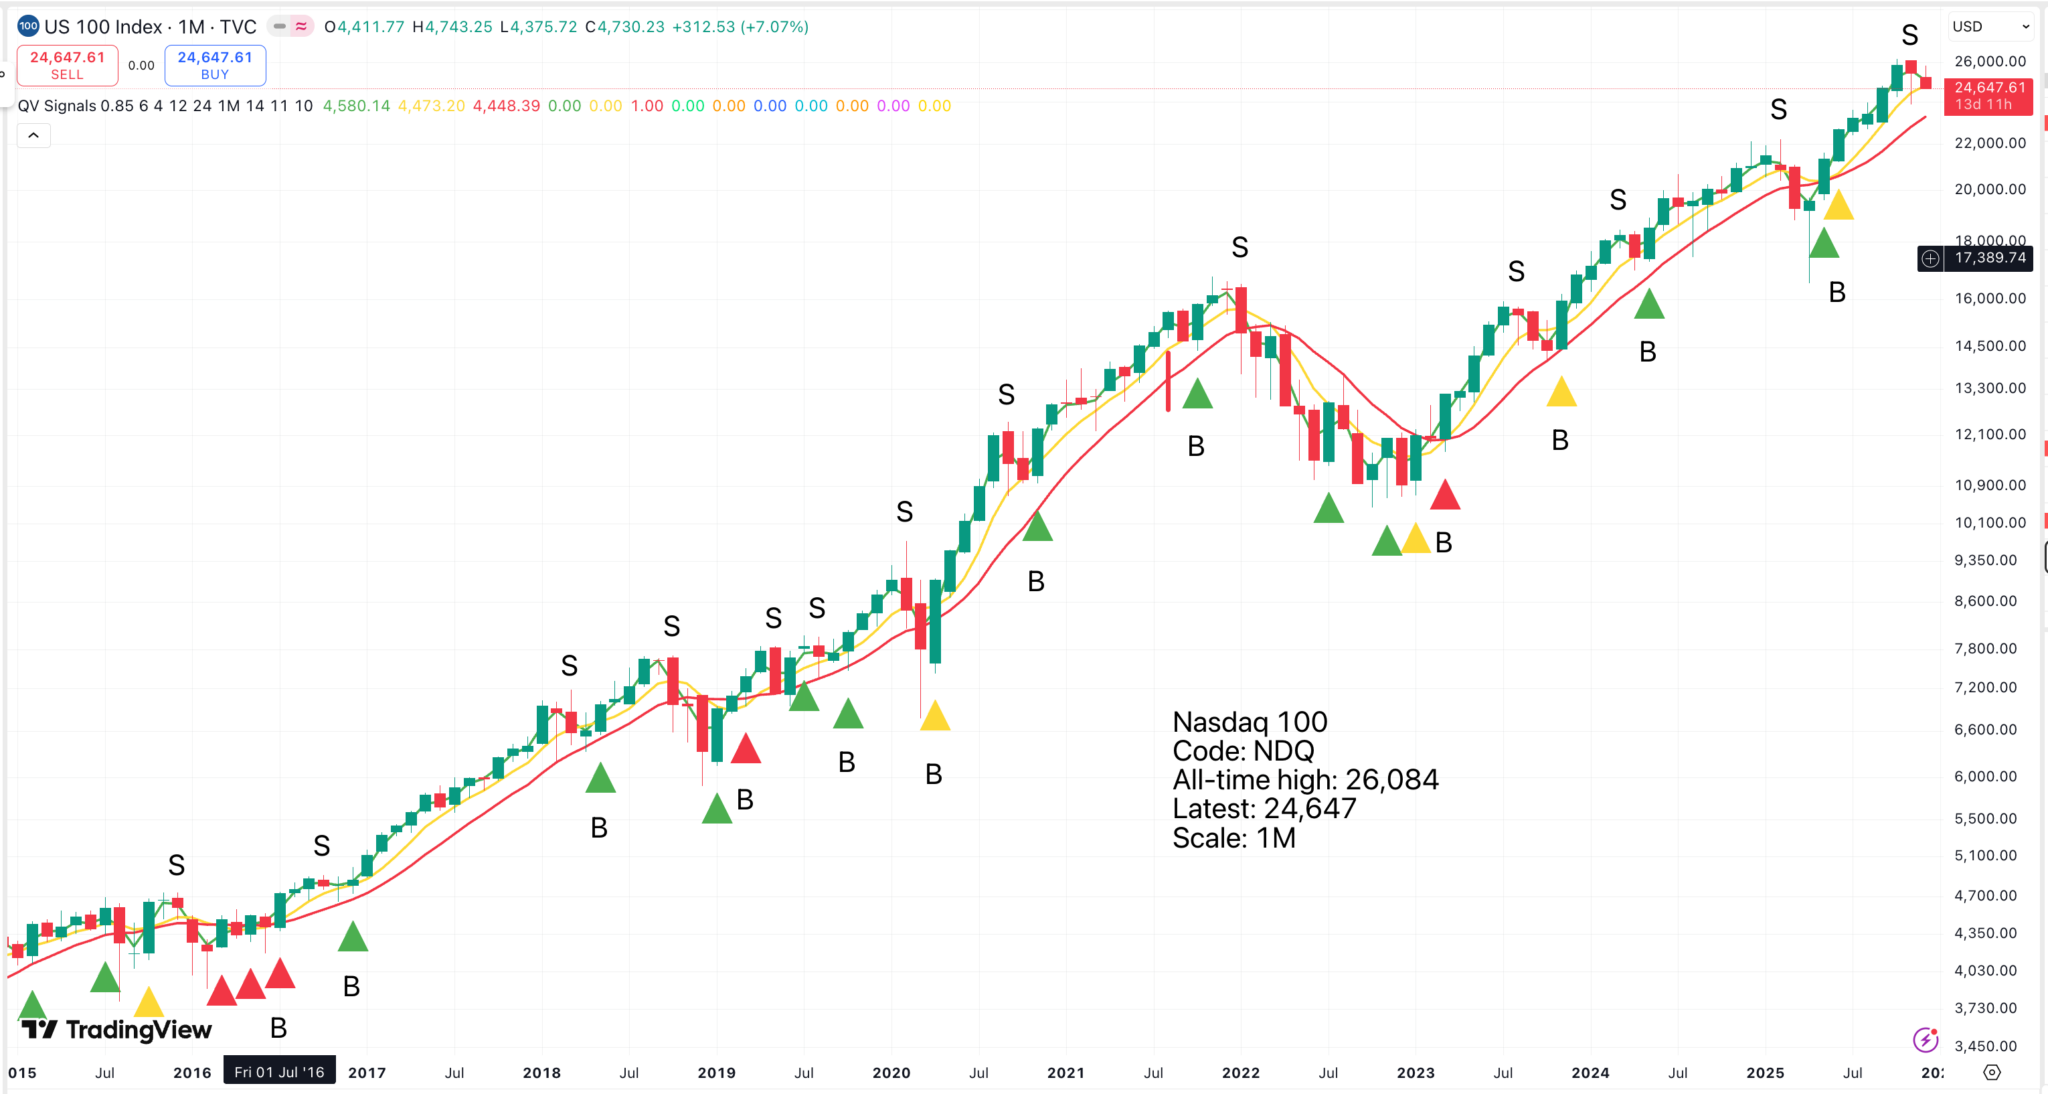
Although there is still work to be done, what we have here is the foundation for a simple trading system. Buy signals are given when all three moving averages are heading higher. This means that buy signals occur when the longest-period moving average turns up from a falling trend.
If both the yellow 12-month and red 24-month moving averages are already climbing, then a buy signal is given when the green 4-month moving average turns higher. If the yellow m/a falls and then turns higher against the background of a rising red m/a, the yellow buy signal takes priority. If the red m/a is falling, which does not happen often, this is the moving average that gives the signal. These red m/a signals are often highly significant.
If you are following a buy-and-hold strategy, say of QQQ, an ETF which tracks the Nasdaq 100, you can use the buy signals to add to your position. Sell signals are given whenever the green m/a turns down and are often quickly reversed. The reason for selling is to go liquid near a temporary peak in case there is a larger decline.
This may sound unnecessary, but it has an important advantage. Many investors swayed by positive and negative news flow buy near the top and sell near the bottom. Both the strategies described above make sure that you do not make that mistake. For example, in 2022, you would either have done nothing as you waited for the next (red) buy signal or you would have closed your positions near the peak and been ready to reinvest when the red buy signal was given.
The reason we need to do more work is to determine which of these strategies works best and where exactly the buy and sell signals are given.
The Nasdaq 100 has a great record of recovering from setbacks and reaching new peaks. This is not always the case with individual shares.
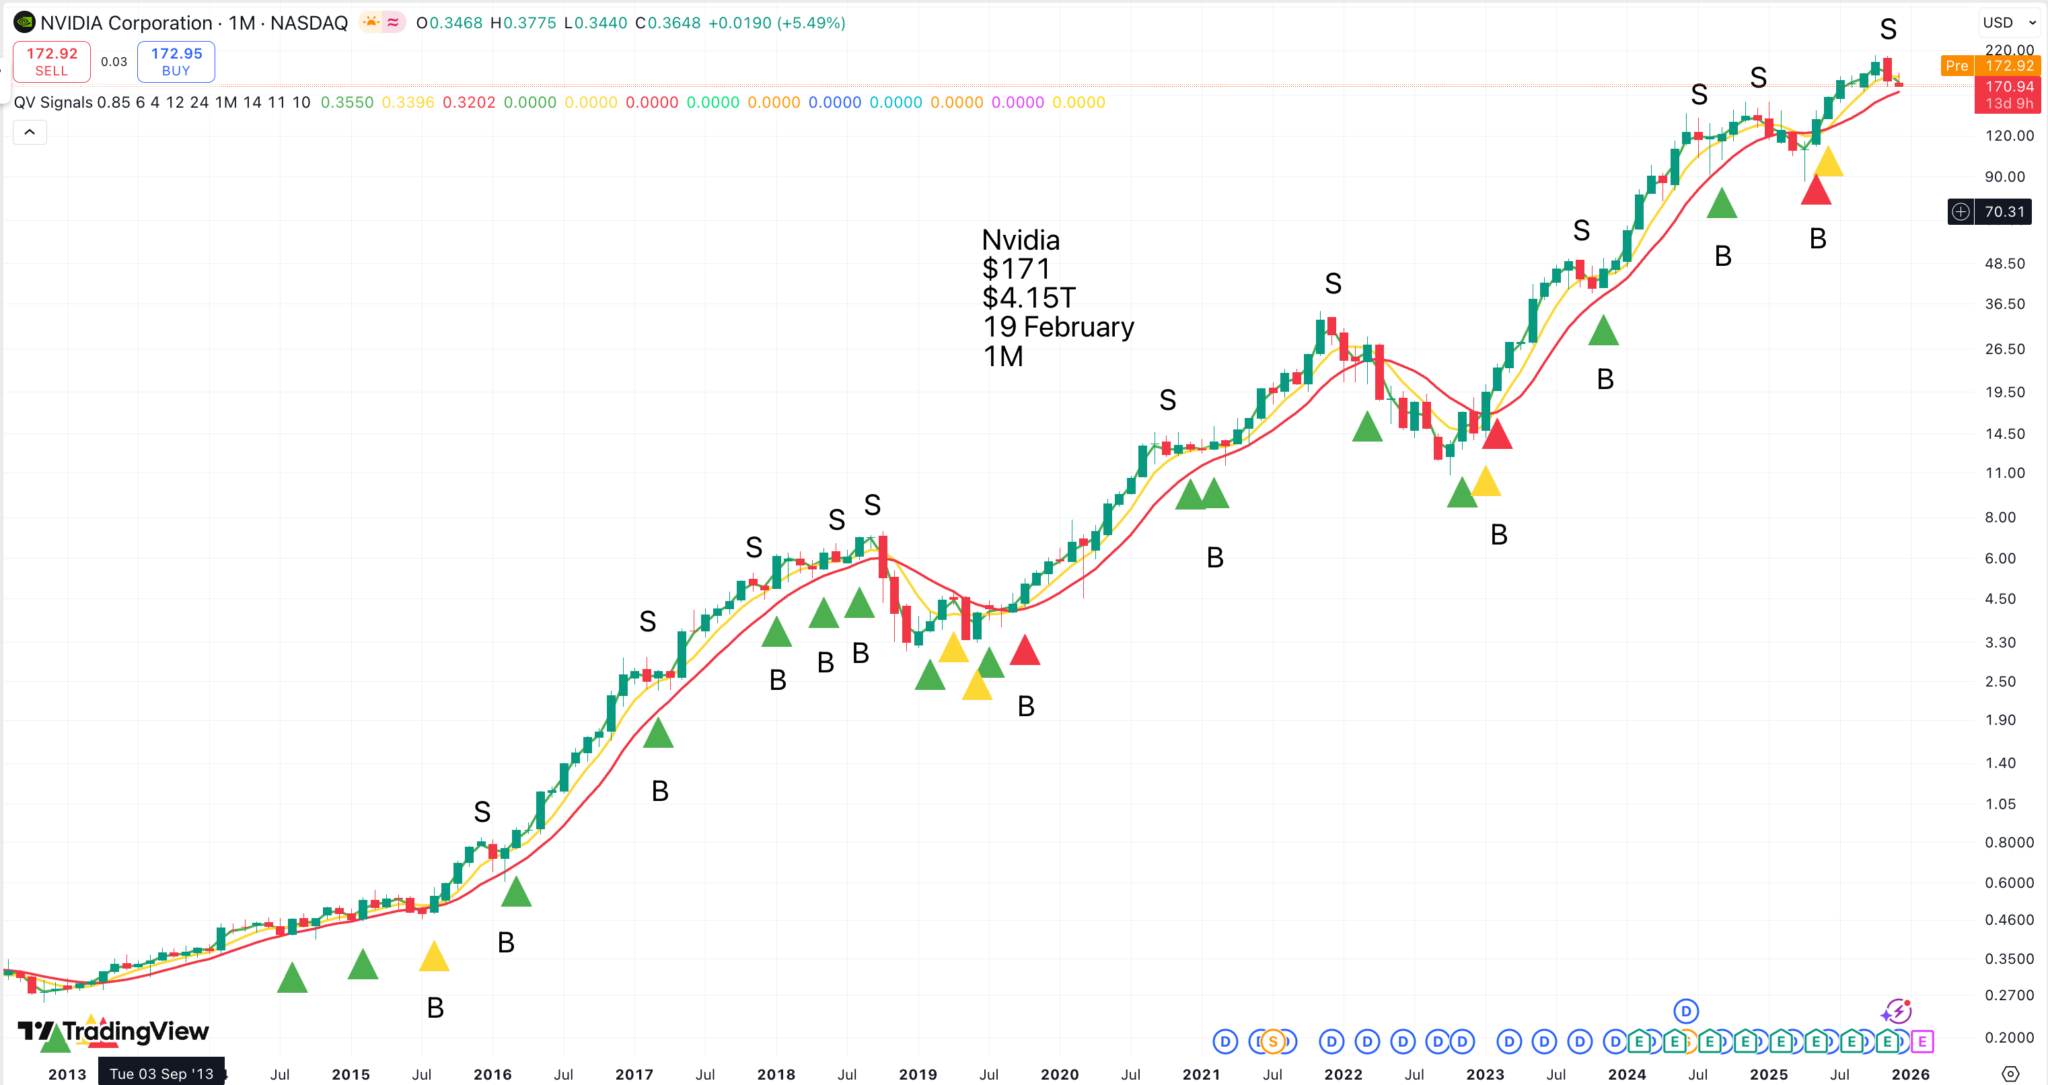
This chart of Nvidia shows buy and sell signals since the bull run in the shares began. The optimum strategy would probably be buy and hold and add to your positions on the buy signals, but the big question is, would you have held your nerve through the declines? In 2018, the shares more than halved. In 2022, the shares fell around 70pc and in early 2025, the shares fell around 45pc. It is not easy to hold during such declines unless you have forgotten that you hold the shares.
If you do sell, it is important to remember to buy back. The red buy signals are important and tend to anticipate significant periods of rising prices. All the big declines were followed by red buy signals.
This is all about momentum. The reason we are investing in Nvidia is that it has exciting fundamentals and the price is in a secular uptrend. After that, we are looking for clues to whether the shares are losing or gaining momentum. When they are gaining momentum, we want to buy and hold. When they are losing momentum, there is a case for precautionary selling.
A problem with shares is that often they behave in a way which does not reflect the news flow. Companies can announce great results and then fall sharply. This is why it makes sense, after buying an exciting share, to take all buy and sell signals based solely on the charts.
Or you can buy and forget, which, as we know, is often the best strategy. If buy and hold regardless is not for you, then it makes sense to make precautionary sales as described above. It is a variant on buy and hold. Effectively, you hold the shares when ALL the moving averages are rising, sell whenever the green moving average turns down, and repurchase your shares when the longest moving average, which is falling, turns higher.
This more cautious strategy should still help you capture a large chunk of the gains on a strong performer and help you avoid disasters on a share that goes into freefall.
Peloton provides a vivid example of the pitfalls that await the unwary.
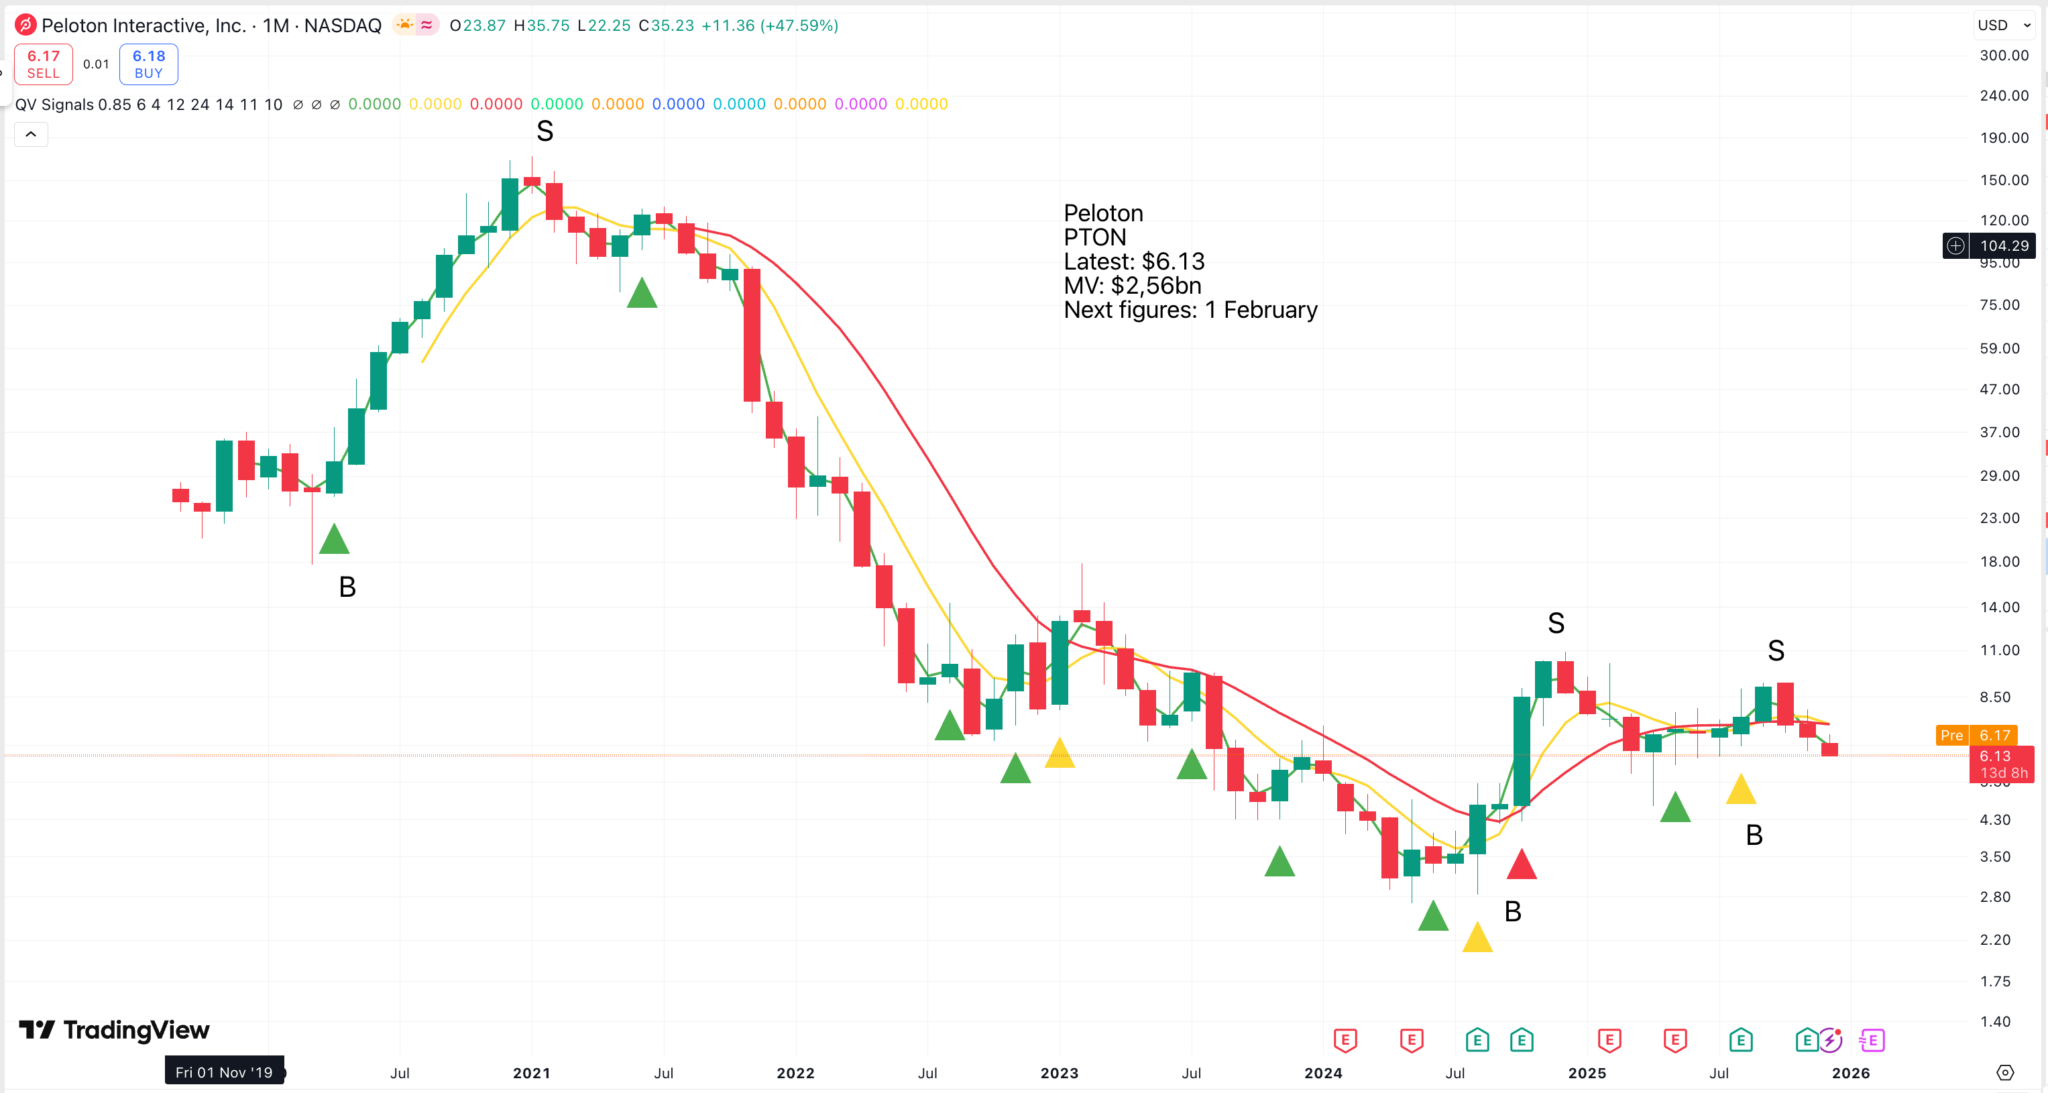
Buy and hold has been a disaster with Peloton, but my trading system has worked brilliantly. You would have captured nearly all the gains and avoided heavy losses. This share needs a major ‘something new’ on the fundamentals to make it interesting again.
In December 2020, Peloton was reporting explosive triple-figure growth. Almost nobody would have realised that the share price would soon collapse. It was the chart which told the story of what was coming.
Crowdstrike is a more nuanced example. Unlike Peloton, the business never fell apart, and CrowdStrike remains an exciting business.
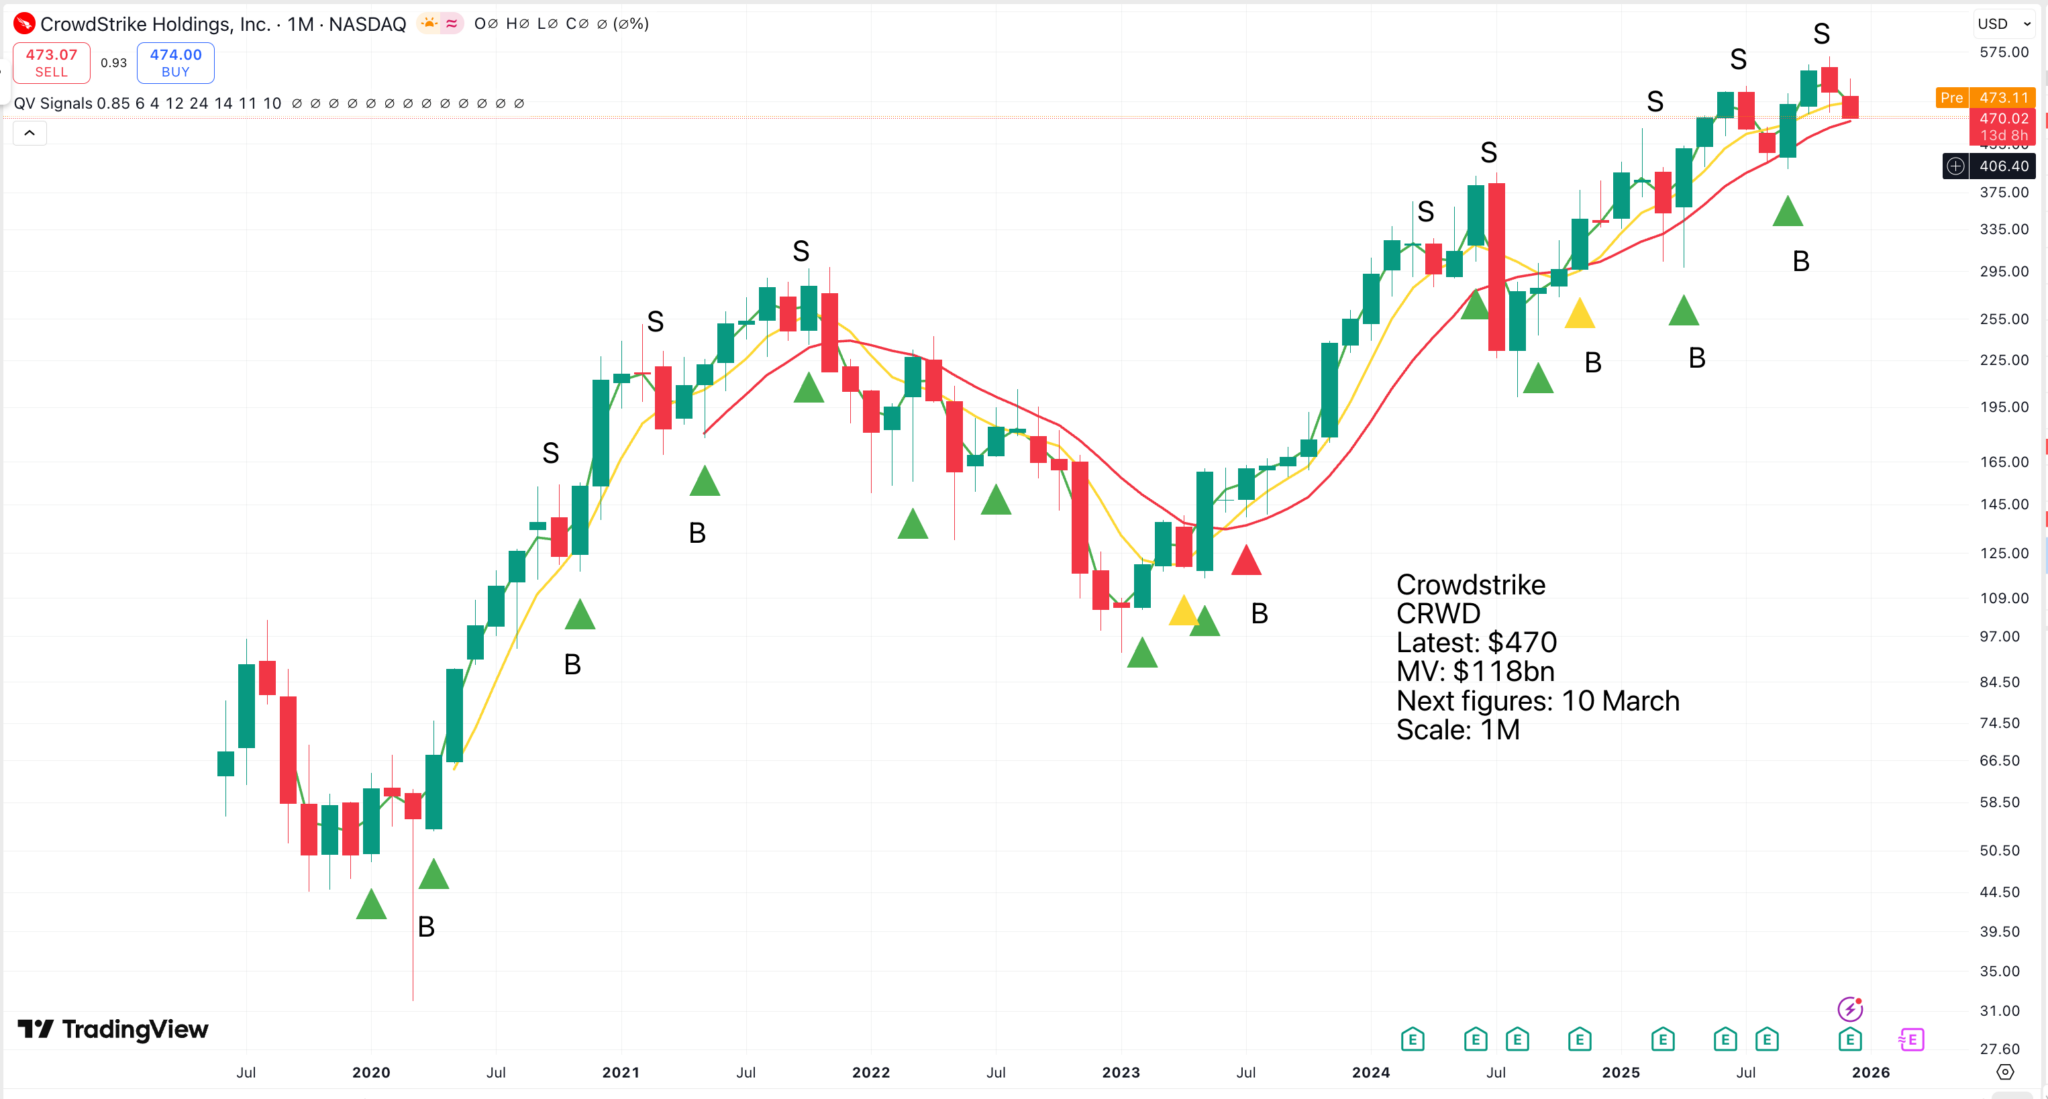
Buy and hold or buy and add would most likely have been the best strategy, but the cost of selling and buying back would not have been too great and would have protected you from some scary declines. As with many shares presently, the latest advice from the trading strategy is to be liquid.
Microsoft shows the security that comes from sales, but also that security comes at a cost.
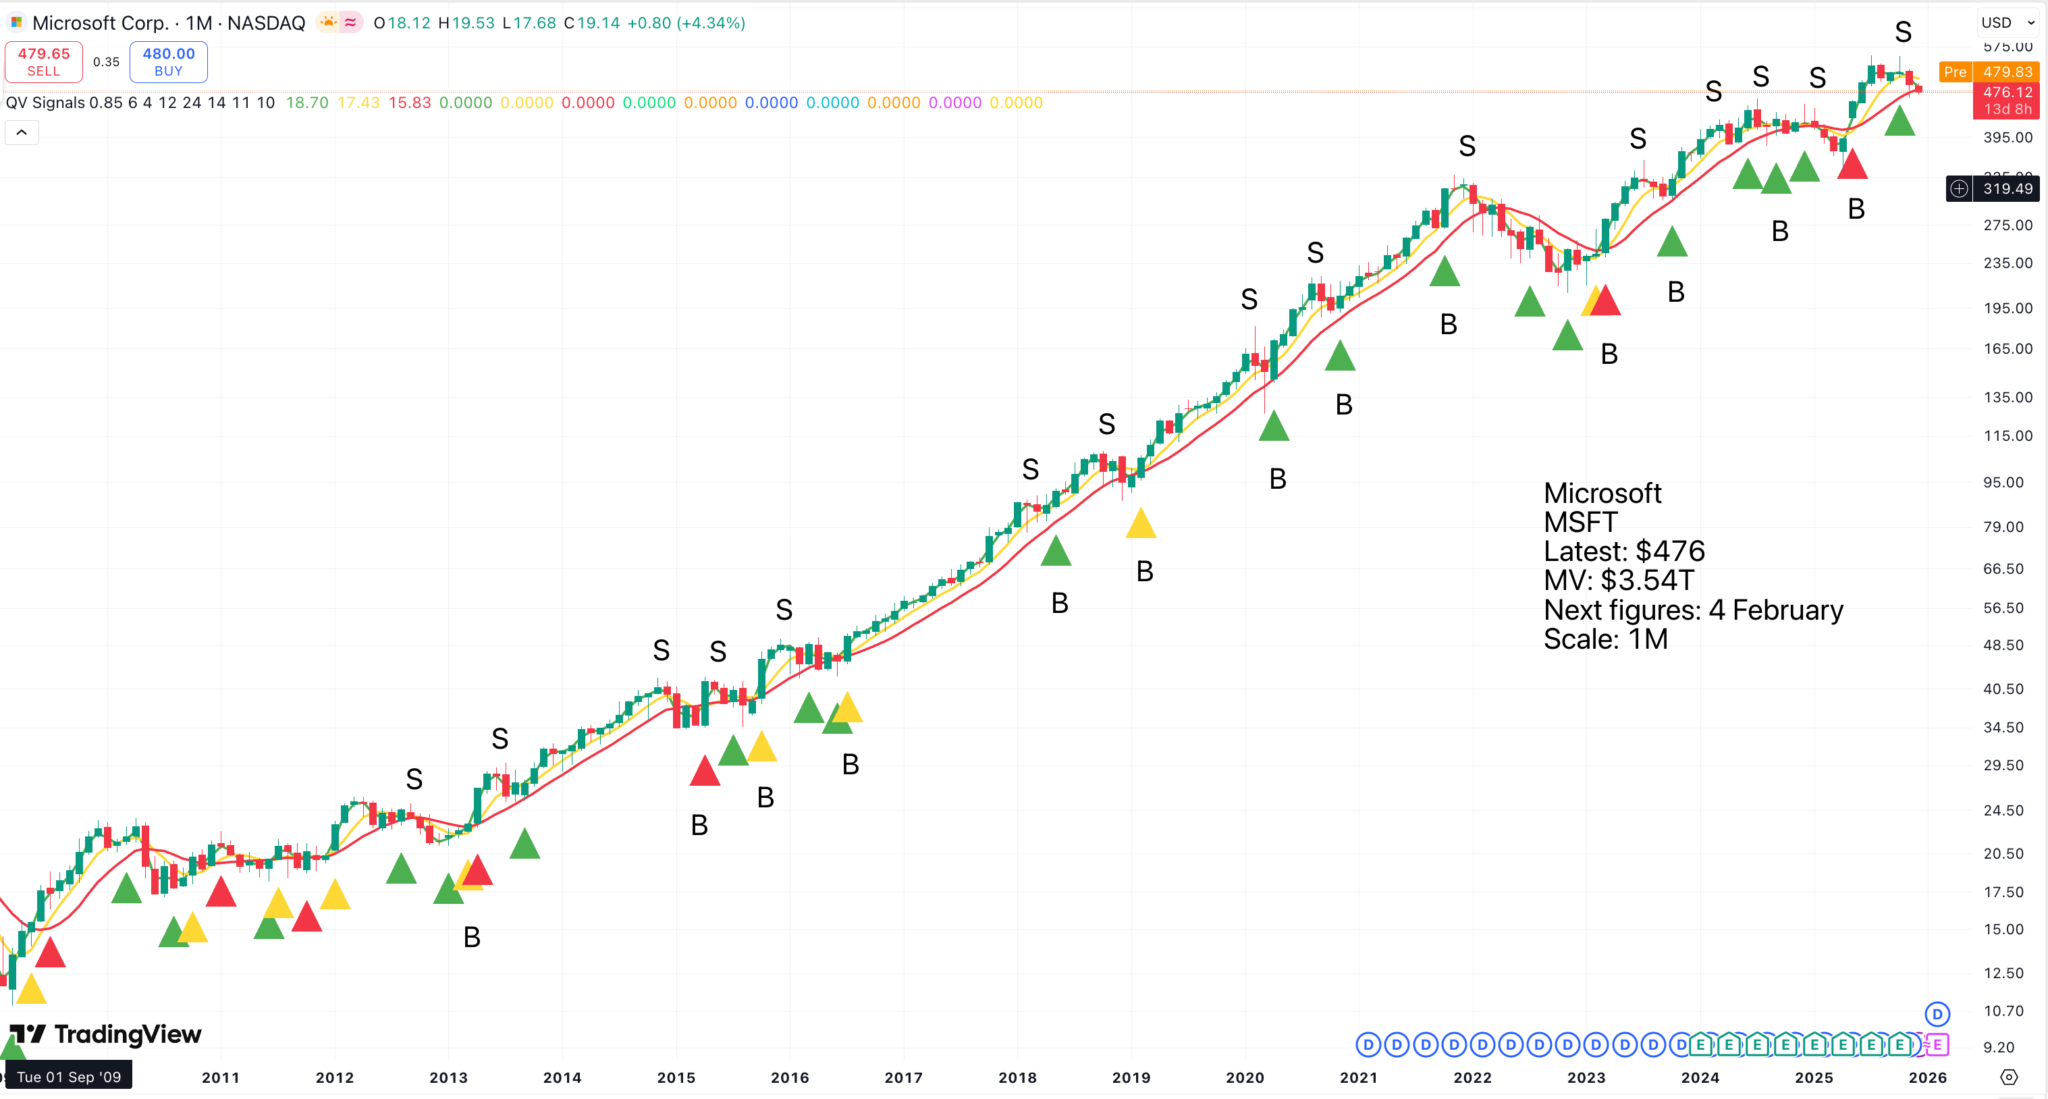
Quite a lot of this buying and selling has proved to be unnecessary. Buy and hold or buy and add would have done better, but the security of not holding the shares in more severe declines has great value. The current position is that you would be liquid. We need to do the maths to work out the difference between the various strategies, which is complicated but hopefully not impossible. It is on our to-do list.
Bitcoin has a negative chart pattern on the moving averages.
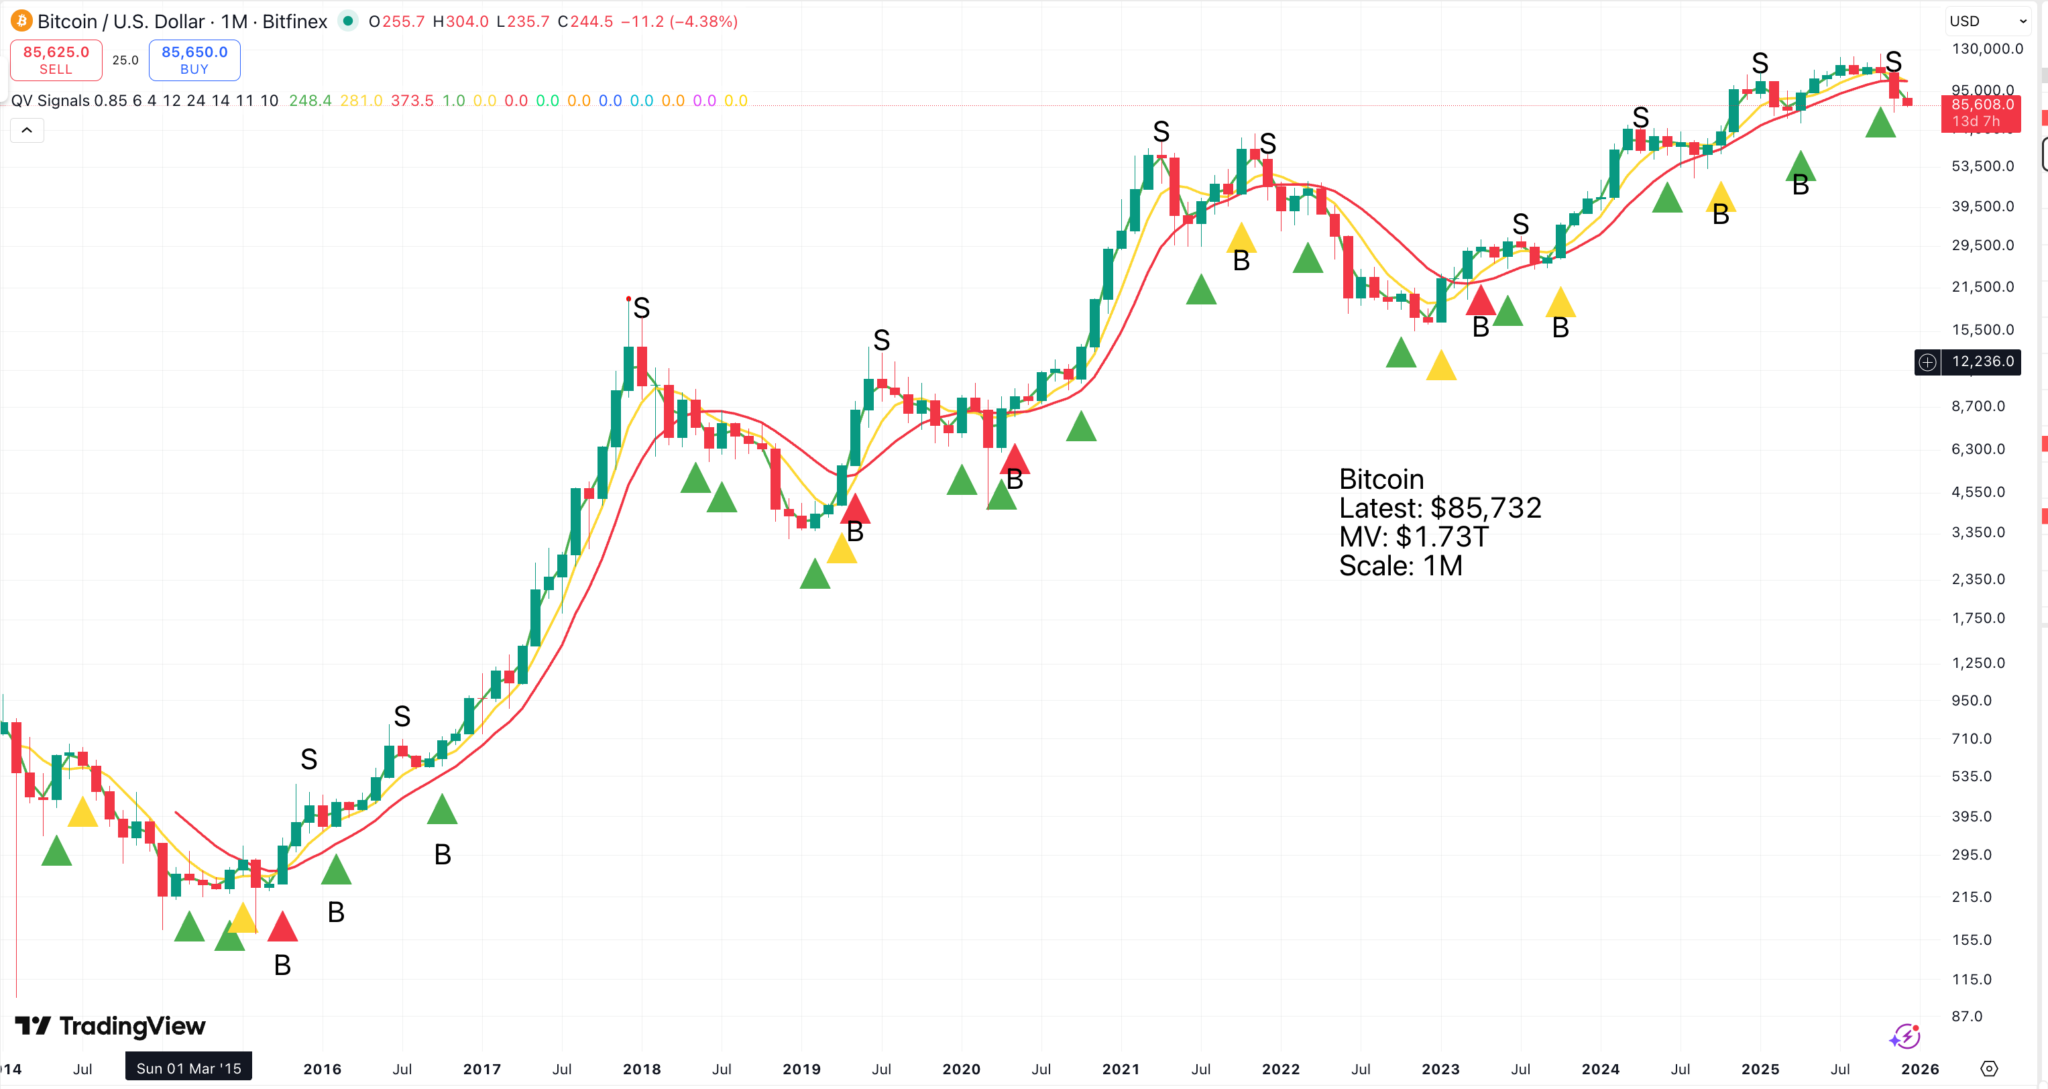
The red moving average is rolling over. This could be the harbinger of a more extensive decline and means the next buy signal is likely to be an important one.
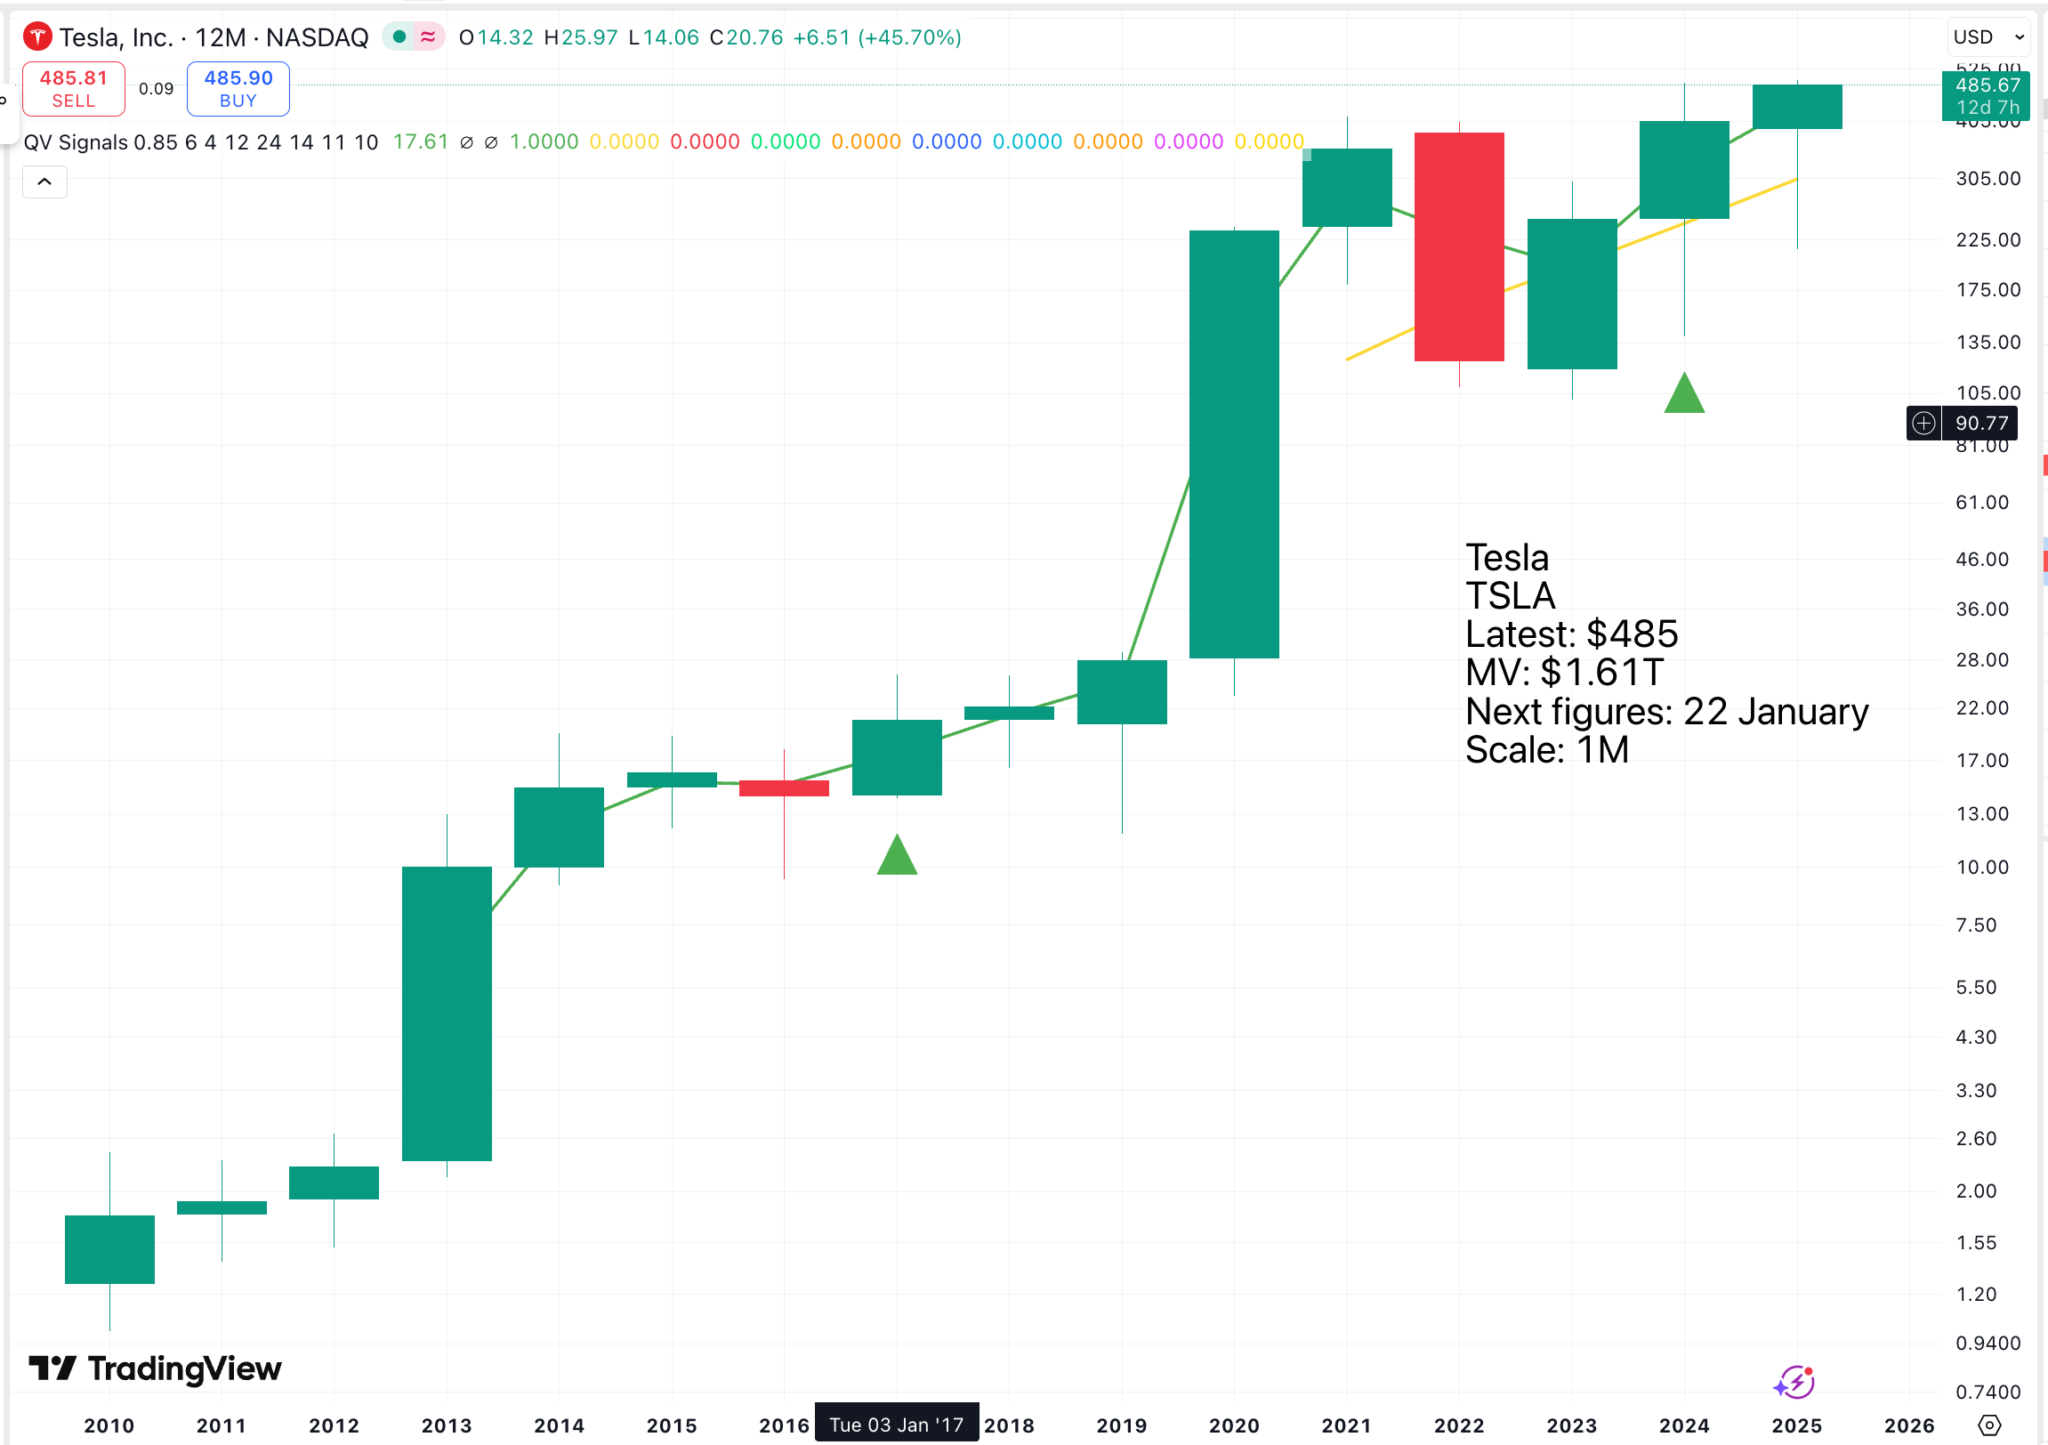
This is a promising chart. The idea is that autonomous vehicles and robots will transform Tesla’s business. There is also the possibility of corporate activity involving Musk’s other companies, SpaceX, xAI, and X (formerly Twitter. This would put Musk at the head of a true mega corporation with strong cash-generative products and services and huge investment opportunities. Who knows what the future holds for Tesla, but it is likely to be exciting.
My go-to analyst, Dan Ives of Wedbush Securities, is a major bull of Tesla.
Ives, Wedbush’s global head of tech research, stated in his post that Tesla is entering a pivotal period as its autonomy and robotics ambitions move closer to commercialization. He expects Tesla’s market cap to reach $2 trillion in 2026, representing roughly 33% upside from current levels, with a bull case up to a $3 trillion market cap by year-end.
Overall, Ives noted that 2026 could become a “monster year” for TSLA. “Heading into 2026, this marks a monster year ahead for Tesla/Musk as the autonomous and robotics chapter begins. We believe Tesla hits a $2 trillion market cap in 2026 and in a bull case scenario $3 trillion by end of 2026… as the AI chapter takes hold at TSLA,” the analyst wrote.
Teslarati, 15 December 2025
Elon Musk’s massive pay package with Tesla, potentially worth $1 trillion, would deliver full value if the Tesla valuation reaches $8.5bn. He probably thinks that is perfectly achievable.
Share Recommendations
QQQ (tracks Nasdaq 100)
Tesla TSLA
Palantir. PLTR
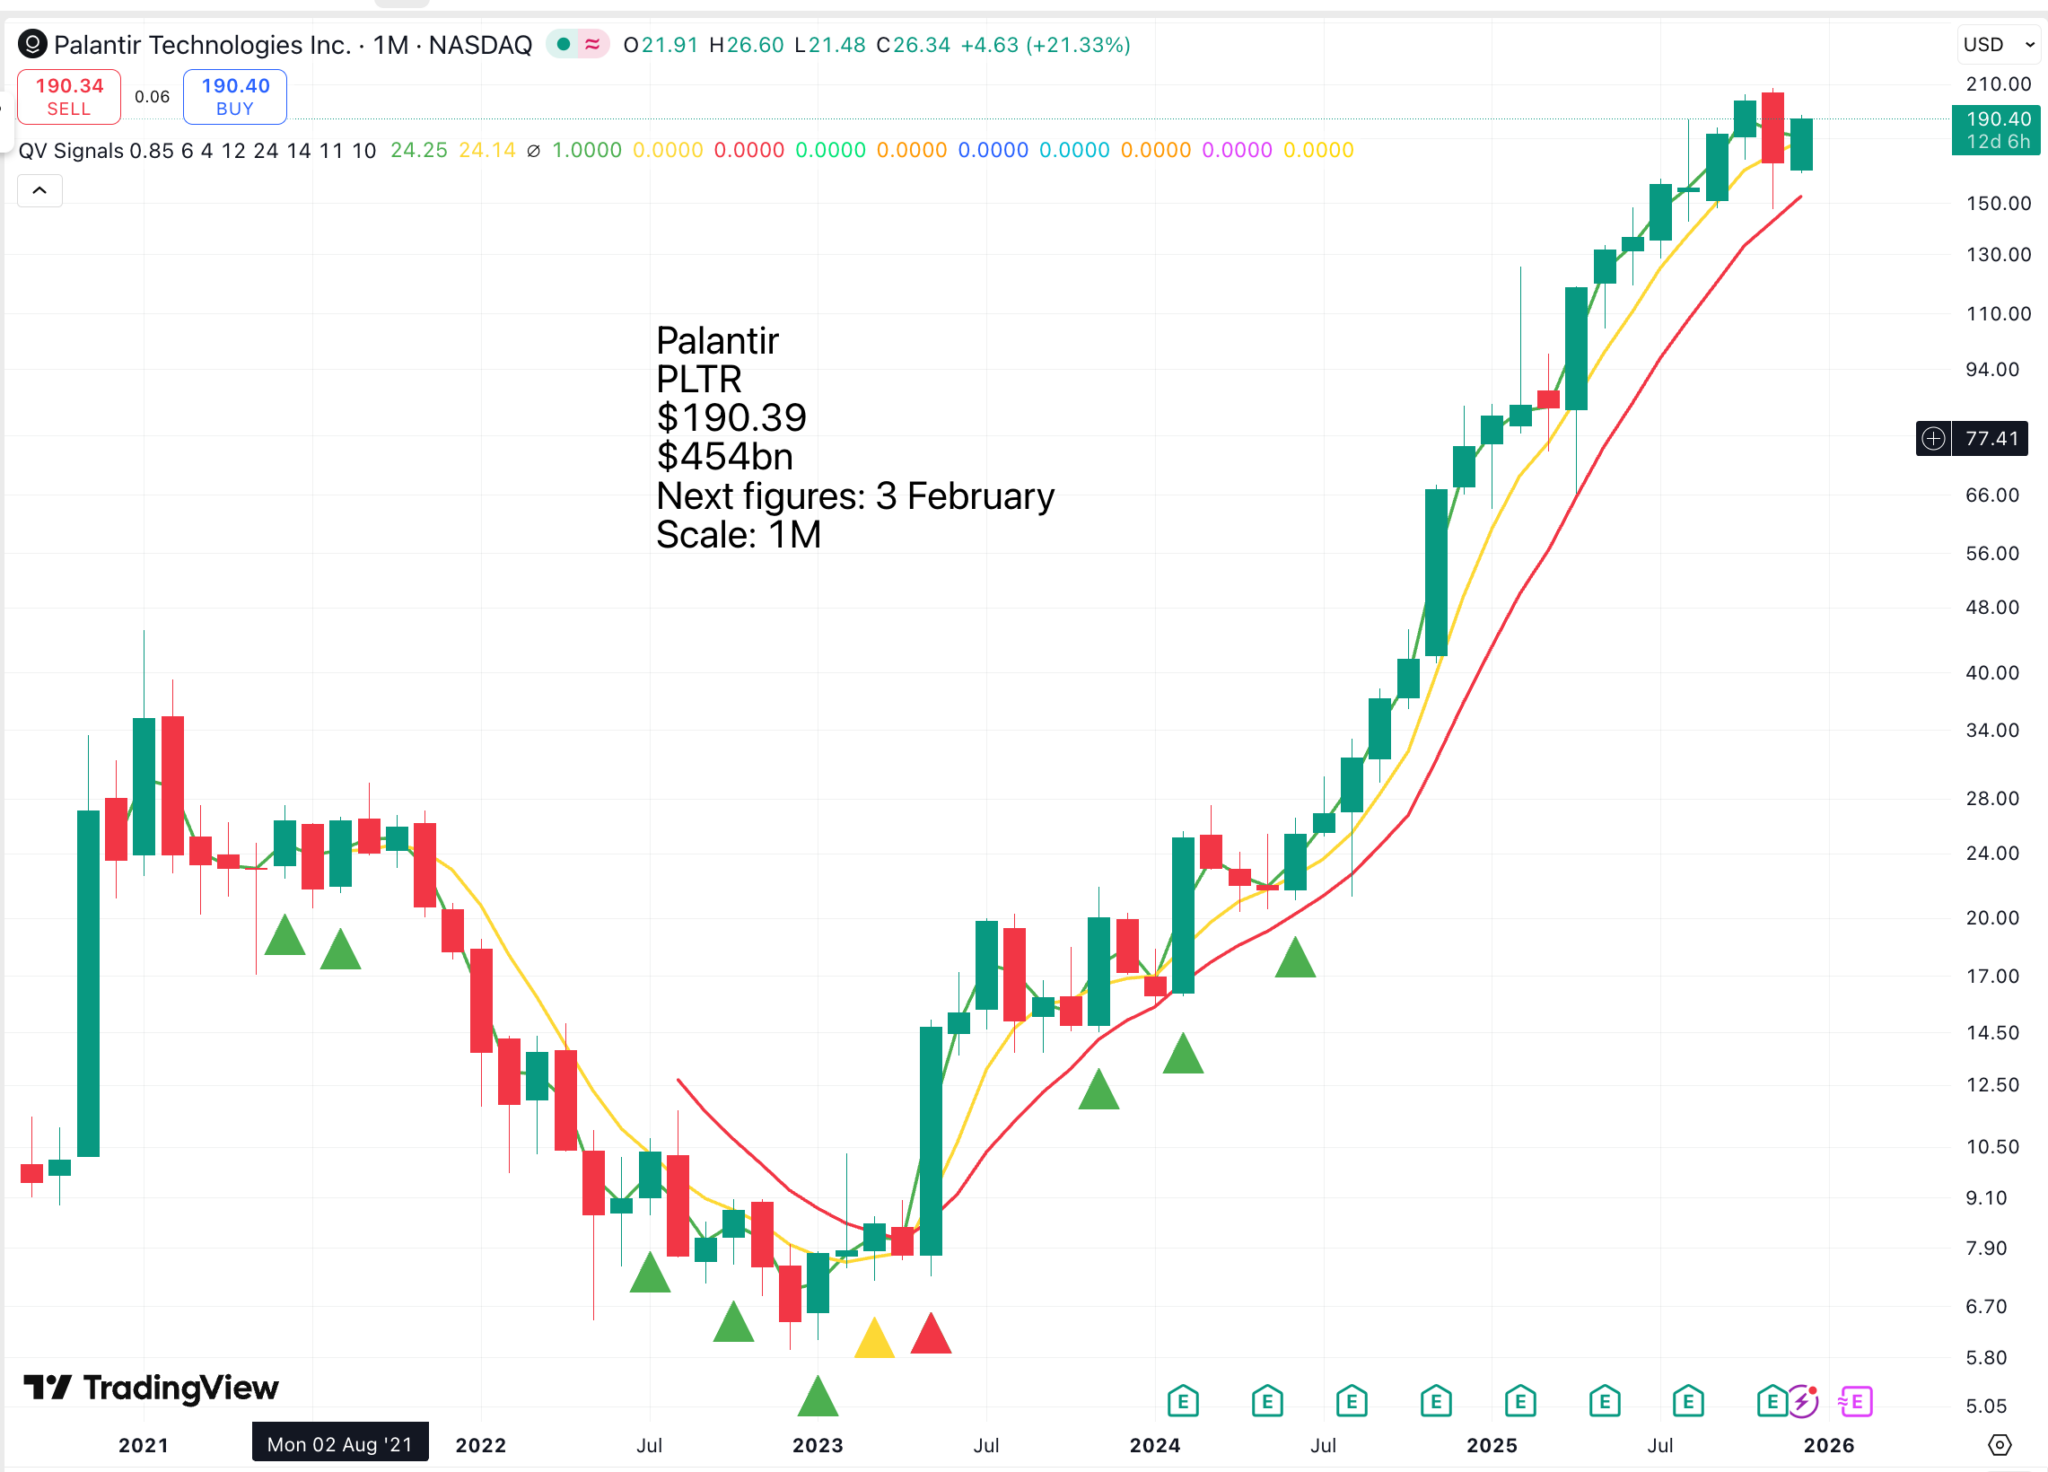
Something striking has happened to Palantir shares. Their price has crossed decisively above the Nvidia share price. I remain a bull of Nvidia, but this crossover makes Palantir my preferred choice of the two companies.