Bear market trend spreads to mega caps as we make plans for the next bull market
Normally when a bear market gets under way you can see what is happening with the indices. This bear market has been different because the weakness began with shares in very fast-growing companies. The first domino to fall was a group of Chinese hyper-growth businesses quoted on Nasdaq and in Hong Kong. These shares rose very high very fast but in recent months they have collapsed.
Futu is a fast-growing share trading platform quoted in Hong Kong. In March 2020 the shares were around US$8. In the next 11 months they climbed to a peak around $204. They built a five month top area and broke down in August. The latest price is around $39 even though, when last reported, the business was still growing rapidly.
Other US and HK-quoted Chinese shares have followed a similar pattern with values tumbling in the last six months. There are signs of consolidation at the lower levels but no sign yet of a reversal. Meanwhile there is much talk of a Chinese property bubble after many years of sharply rising prices. Investors have been buying apartments in remote areas which don’t even have basic amenities and will probably never be completed. Shares in the second largest Chinese property developer, China Evergrande, have plunged from HK$16 in March 2021 to HK$1.71 currently.
At first shares in fast-growing US companies, the US counterparts of the shares collapsing in China, carried on climbing but in November these shares started to fall. On 6 December 2021 I sent out an alert on US shares saying it was time to ‘Circle the Wagons’ and that subscribers should consider sharply pruning their portfolios or even going completely liquid.
On 6 January I sent out a follow-up piece saying simply ‘Charts Look Terrible’. I am able to gain these insights because when I update my tables I look at many individual charts and this is what gave me the clue that even though the indices were holding up all was not well with the stock market – under the water a shark was circling.
The charts remain very threatening with even the mega caps showing signs of breaking down. Netflix reported disappointing subscriber numbers and the shares plummeted They are oversold presently but any bounce is likely to be short-lived. Shares in Amazon have also broken down completing a top area going back to August 2020.
If charts were absolutely reliable we would all be billionaires but these sharp moves are alarming because they look like breakdowns with more weakness to come. Any rallies should be regarded with great suspicion until we have serious evidence of a turning point.
I have just been through the Nasdaq 100, which is an index of the 100 largest non-financial shares quoted on the Nasdaq market. The charts do not look good with 53 shares in clear downtrends and hardly any shares giving buy signals.
Shares have been falling steeply so sharp rallies can occur at any moment. After both my earlier bearish alerts shares immediately rallied strongly but that is the problem with bear phases in the stock market. The rallies don’t last and the slide resumes. This is why it is important not to be drawn into rallies and to watch and wait until we have stronger evidence of a turning point in the stock market.
As well as individual charts and the ratio of buy to sell signals which is currently heavily skewed to the latter I shall also be looking at my Coppock indicators which have an extraordinary record of signalling turning points in the stock market. They are not very reliable for telling you when to sell but they have an amazing record of success in telling you when to buy. In bull phases I don’t even bother to calculate them but I shall be looking at them now. In the past they have been amazing at pinpointing the bottom of the market.
Part of the problem for stock markets is that an enormous amount of liquidity has been chasing shares in a relatively limited number of exciting companies. In the last issue of Great Stocks I gave the example of Shopify. There is no question that it is a fabulous business led by some exceptionally talented people and it is very much a 21st century operation. There is nothing old school about Shopify which provides a platform and services for people who want to do business online or in a multi-channel environment.
But ultimately there is a price for everything and enthusiastic investors had pushed Shopify’s valuation to £220bn in November. This compares with expected sales for 2021 of $4.77bn rising to $8.22bn by 2023. This is a valuation not too far short of 50 times sales which is a lot. If the value dropped to 25 time sales this is still not exactly bargain basement and that is more or less what has happened with the shares trading at around $885. Note that we have not even mentioned profits, with 2022 earnings per share expected to be around $3.20. Down from $1407 in a month they could easily rally sharply but any rally immediately takes them back into pricey territory in a market where there appears to have been a sea-change in investor sentiment.
The other worry which I highlighted in both my earlier alerts is margin debt which had recently built up to around $1 trillion. If these investors become forced sellers which most likely some of them will that is going to put further pressure on share prices.
The way the charts work, at least for me, is that my moving averages turn down and rising trend lines get broken. It was seeing this start to happen on a broad scale which so alarmed me leading to my first bearish alert on 6 December. Since then there has been a further deterioration with January shaping up as a bloody month for share prices.
Two things are now happening. The number of shares with declining moving averages and broken rising trend lines is increasing all the time. Secondly, we are seeing important shares forming top areas, from which they have broken down. Once this happens further weakness becomes very likely and shares can always fall faster and further than anyone ever expects when the bear phase begins.
Of course, it is also true that shares will bottom out while the charts look terrible. This is what makes life so complicated, why I like to wait for buy signals and why my Coppock indicators can become important.
It is still perfectly possible, likely even, that when the dust finally settles and this bear phase burns itself out that many shares will remain in very long-term uptrends. Shopify is down sharply at around $885 as I write but it is still up from $18.50 in January 2016.
The other thing about Wall Street is that it is so easy to sell shares short and there will no doubt be many short sellers active in a market as weak as this one has been. Short sellers need to cover their positions and will rush to do so if prices start to rise sharply which is why, even in a bear market, you can get explosive rallies. The problem with these rallies is that they don’t last. One day they will but by that time the gloom may be so thick you can cut it with a knife.
Another share which tells a story is Nio, the US-listed, Chinese maker of electric cars. The business is very exciting. It is growing fast and the market opportunity is huge but so is the valuation. This shows the importance of sentiment or why beauty lies in the eye of the beholder. Nio’s sales are expected to grow from renminbi 5bn for December 2018 to renminbi 97bn for 2023, an increase of roughly 20 times. In US$ terms that is an increase from $US790m to US$15.33bn. This compares with a market value for Nio of $45bn.
The latest fall in the Nio share price to around US$22 has completed a top area built up over the last 13 or 14 months. There is no serious support above US$5 so the price could easily fall sharply further. In October 2019 Nio shares were US$1.20 so there are still many investors sitting on large profits.
Another important bellwether stock we could look at is Alphabet/ Google. The shares have been in an incredible long-running bull market since November 2008 when the price was around $128. The company had its IPO in 2004 at $42.50. They are. now around $2,628 having been as high as $3019.33. They have a small top area, have broken a rising trend line going back to March 2020 and the moving averages I follow have completed a dead cross (shorter moving average falls below a declining longer moving average). This is bearish but doesn’t tell you how far the shares might fall. It just adds to the picture of a stock market under pressure where even the most solid names are attracting selling. As a business Alphabet/ Google is about as good as it gets.
We still don’t know what is driving the selling. It could be fear of higher interest rates. It could be fear that a bursting property bubble in China could lead to a dramatic slowing of their economy. It could be fear of a new cold war if Russia attacks Ukraine or it could be something else. Simplest of all it could just be that after a long bull run we need to purge the financial excesses out of the system. Valuations have risen too high and margin debt needs to be rolled back to a more sustainable level.
It is hard not to feel that there is still worse to come. I am looking at a chart of O’Shares Global Internet Giants (OGIG) which holds an exciting portfolio of fast-growing technology companies. Unfortunately these are just the shares that are in the front line of the current sell-off. OGIG shares are in free fall having completed a major top area. There is strong support around $25. If I knew nothing about them but just saw the chart I would say they were vulnerable to further declines. The weekly moving averages turned down in mid-November when the price was around $56 and they have been falling ever since.
Unfortunately there are threatening chart formations almost everywhere you look. Netflix shares plunged some 20pc after reporting disappointing subscriber numbers and saying that they were being affected by rising competition. The chart shows declining moving averages, a decisive breach of the rising uptrend line in force since 2013 and a breakdown from a large top area. It is not a good chart.
The whole video streaming sector looks weak with charts of shares like Amazon (Amazon Prime Video), Disney and Roku also falling. Competition could affect the ability of sector players to raise prices while forcing them to keep spending heavily on content. Suddenly they start to look more like the old film studios, forced to pour money into making movies and so struggling to drive high profit margins.
It’s easy to make a case either way with shares. When they are climbing there are many reasons why; ditto when they are falling which is why we turn to charts in the first place.
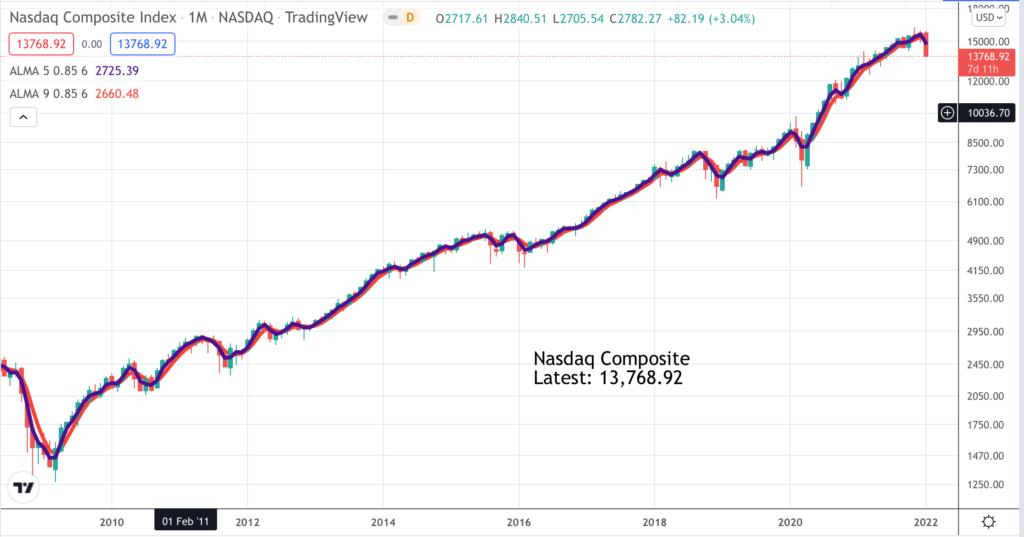
As shares in the mega caps like Apple, Amazon, Alphabet, Netflix, Nvidia and Tesla come under pressure the indices too are turning down and giving sell signals. The Nasdaq 100 has broken a rising uptrend in force since October 2020 and the moving averages I use have completed a dead cross. There is no real top area but equally there is no real support above 1200, v a latest level around 13,800 and one of the signs of a bear market is that support levels don’t hold. The index is up from 1,040 in 2009 so in chart terms anything could happen.
Usually with Great Charts I list bullish charts of shares with brief explanations of what is driving the price action. In a bear market investors stop paying much attention to individual share fundamentals, unless they are bad in which case the shares are hammered. So I am not going to try to analyse what is happening but mainly discuss the charts. The fact that shares like Netflix and Docusign are seeing their shares so brutally punished when they report disappointing news is itself a sign that we are in a bear market.
It’s not a good sign that prices of key crypto currencies are also under pressure. Bitcoin has broken its recent uptrend and competed a dead cross. There are also the makings of a double top which if confirmed could see the price falling much lower. Bitcoin is almost the ultimate example of a financial instrument with no supporting fundamentals to provide a floor in a bear phase. This helps it do well when buyers are active but makes it vulnerable when sellers need to raise funds.
The list of warning signs goes on and on. Paypal made a double top between February and July 2021. In September they broke their rising uptrend and in October it was confirmed that the moving averages were falling in bearish formation. The next major level of support is around $115 against a price, as I write, of $157, down around $5.50 on the day.
Shares could bounce any time if something triggers a rush of short covering but with levels of margin debt still likely at elevated levels there is also the potential for a stock market panic and some kind of climactic sell-off. Since 2016 shares in PayPal have gone from $30 to $310 to $154. There could still be more downside ahead and rallies may well run into short-selling.
The other thing to watch for in a stock market under pressure is that if companies report great results even then the resulting share price rallies may not last. Bear markets can be very treacherous things. On the way down there will be repeated attempts to rally but if they do not change the trend they are not to be trusted. How do we know if the rally is for real and the trend has changed; that is where indicators like Coppock can be invaluable. It also takes time for a bear trend to work itself out and so far we have not had much time with many shares topping out in November.
Just for clarity the charts below are not giving buy signals. I am posting them to give subscribers a flavour of what is happening in the market.
Last but not least there is an anecdote I want to share with you. It is very unusual for me to have to post an issue of Great Charts without buy signals. There was an occasion in the past when I did this and when I went back to look at it I realised that if all the stocks featured had been buy signals it would have been an incredibly successful issue. So that is something to bear in mind. Bear phases in the stock market can be very painful but they are always temporary. The normal state of affairs is rising share prices as you can clearly see from the share price charts below. Even so I don’t want to hedge my bets. For the moment the charts look bearish and many shares remain vulnerable to further declines.
Alphabet. GOOGL. Latest price: $2613
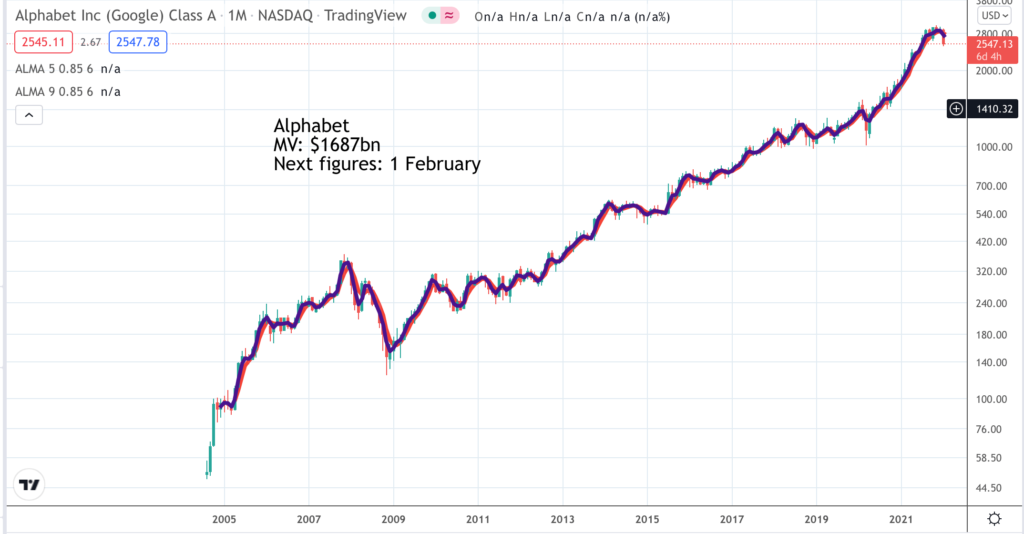
It is clear from looking at this chart that the best thing any investor could have done was buy a load of shares back in 2004 and hold them through thick and thin. It’s a wonderful business and that has not changed. What is clear though is that the shares have had a great run since 2004, since the bottom of the last bear market in 2009 and since the Covid inspired sell-off in March 2020. A correction looks overdue and seems to be happening. The shares have spiked lower triggering various technical sell signals in the process. There is no major top and no reason to expect a massive fall is in prospect but some continuing weakness would not be a surprise as part of what may prove to be an extended period of consolidation. The moving averages I follow turned higher in May 2020 and were followed by 18 months of rising prices. Latterly the shares have been consolidating and now they have broken down. The future is unknown but this could be the prelude to a more extended period of weakness. As with many other shares it is a time to be cautious.
Amazon. AMZN. Latest price: $2835
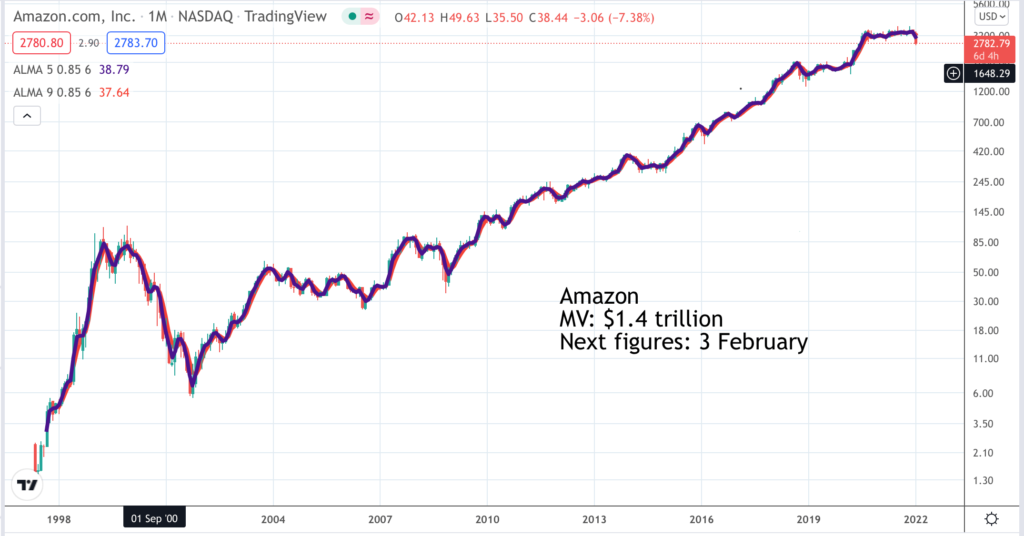
Amazon has been on a legendary bull run since the price fell to around $5.50 in 2001. Trough to peak they are up 686 times. Since July last year the price has been unable to make further progress. There were two attempts to break higher in July 2021 and November, both of which failed. It is clear with the benefit of 20:20 insight that November was the peak of the bull market which makes my ‘Time to circle the wagons’ alert in Quentinvest on 6 December look timely. Amazon shares have recently broken down making all the trading since July 2020 look like a top area. As always with charts there are no sure things but a break down from a line is a serious development and could mean that an extended period of weakness lies ahead for Amazon shares. Rallies, even sharp ones, should be treated with caution unless there is good evidence that the whole stock market is on the turn. In stock markets like this it is not really about individual share fundamentals. It is all about sentiment and the trend and presently, for Amazon and many other shares, the trend appears to be down.
Block Inc. SQ. Latest price: $107.50
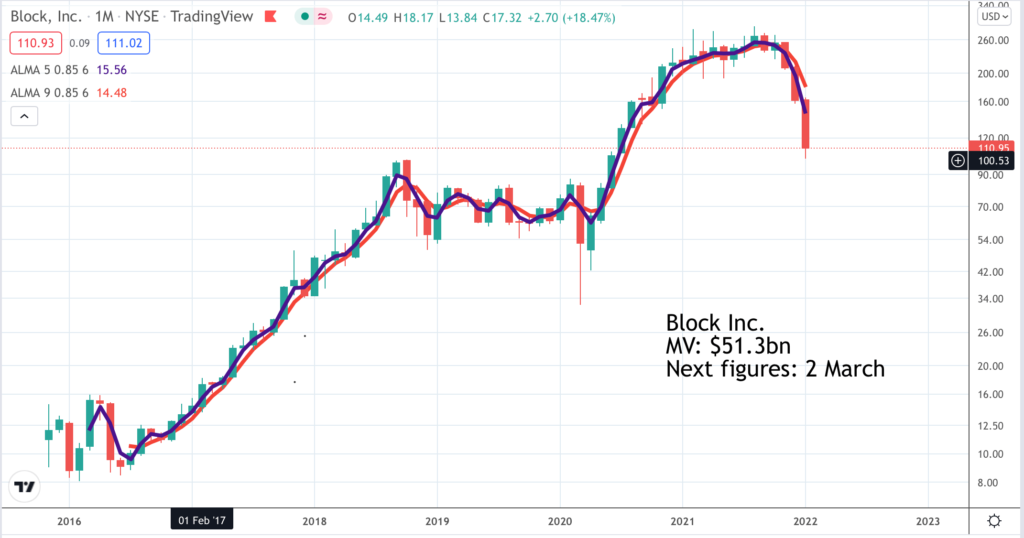
Block Inc., formerly known as Square, is the company founded by Jack Dorsey and best known for its white square card readers. It enjoyed a fantastic bull market with the shares rising from $8 to a peak $289. One of the problems with shares, when sentiment changes, is that it takes a great deal of buying to power a bull trend such as Block has enjoyed but if the buyers stop coming they can fall on a surprisingly modest amount of selling. This is what can make it hard for shares to recover quickly because there are many holders wishing they had sold at higher levels who will come in as sellers as the shares start to rise. This is another reason why. new bull markets are often led by new names. Block/ Square was itself a new name in 2016 and one with a very exciting story in a sector, fintech, which was attracting a great deal of attention with new specialist funds being formed and pumping money into fintech shares, especially explosively fast-growing ones like Block. There has now been what looks like a decisive change of direction. This doesn’t mean it is game over for the company but it will need time. The huge rise was driven by a combination of strong growth and a rising valuation. The future is going to be very dependent on strong growth. If that falters the shares could still be vulnerable.
Cloudflare. NET Latest price: $81.58

Cloudflare looks like a wonderful business. The company provides infrastructure services for the Internet and cloud security. Last Q3 figures, reported in November, showed sales growing by 51pc with all the metrics of the business looking strong. The shares surged to a November peak of $221.64 since when it has been all downhill. It is reactions like this which make share investing so tricky. The company is doing brilliantly so what happens, the price plummets wiping tens of billions off the valuation. Notice also how the price fell straight through support around $120; that is what happens in bear markets, support levels don’t hold. Now we have strong support around $80. We will have to see if that holds. Naturally there is a strong temptation to think the shares must be a buy after such a sharp fall but stock markets don’t work in that way. The price has changed direction. The rising trend line since March 2020 has been decisively broken. The moving averages are pointing down. I would be surprised if we have seen the bottom and the safest strategy is to be very cautious of these shares until the moving averages change direction even if the company continues to deliver a strong fundamental performance.
Docusign. DOCU. Latest price: $115.72
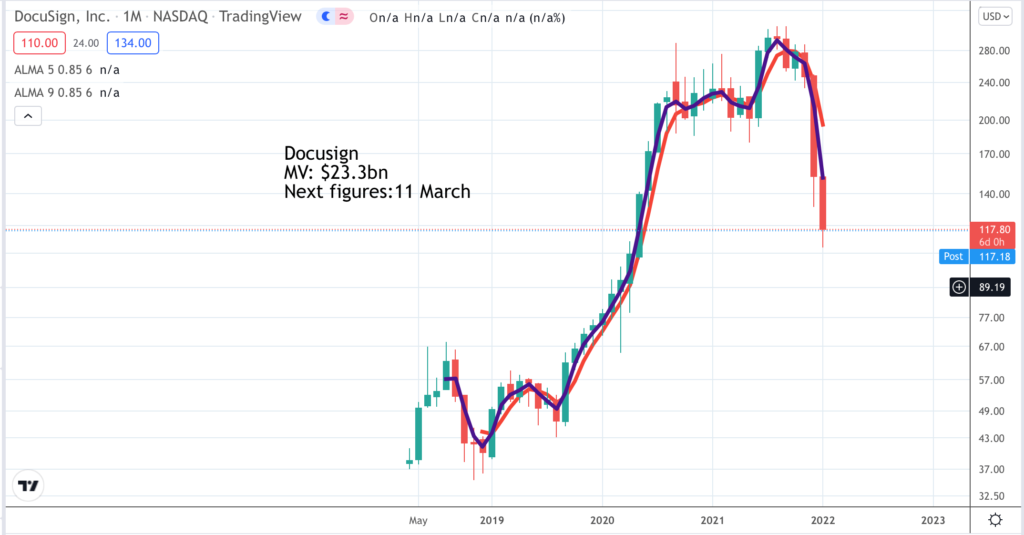
Unlike many other shares which has fallen from grace Docusign did come out with some disappointing news. In early December, shares of DocuSign cratered after the company’s Q4 guidance fell a bit short of analyst estimates. The stock, which had topped out months earlier at nearly $315, lost nearly $100 in a single day closing just above $135. The company’s Q3 report was actually pretty good, as both revenues and adjusted earnings came in solidly ahead of estimates. However, Q4 revenue guidance came in a range $557m and $563m, below the $575.3m that analysts had expected. The company’s CEO noted that pandemic tailwinds seemed to have retreated a bit, with customers returning to normal buying patterns. What seems like a modest shortfall has seen the stock being slaughtered. This is classic bear market behaviour and understandably makes investors nervous about other stocks they are holding if just the slightest failure to live up to best expectations can trigger a share price rout. I have been looking at an ETF focused on stocks that benefit from the trend to work from home, called WFH. Launched in June 2020 this ETF rose from around $50 to peak at $80.24 in September 2021. It has since given a moving average sell signal at around $75 in December and is currently $64.37 and looking in great danger of going lower. Looking at the top holdings led by Fortinet and Atlassian this just looks like another tech ETF but that is not the place to be at the moment.
Intuit. INTU. Latest price: $518.14
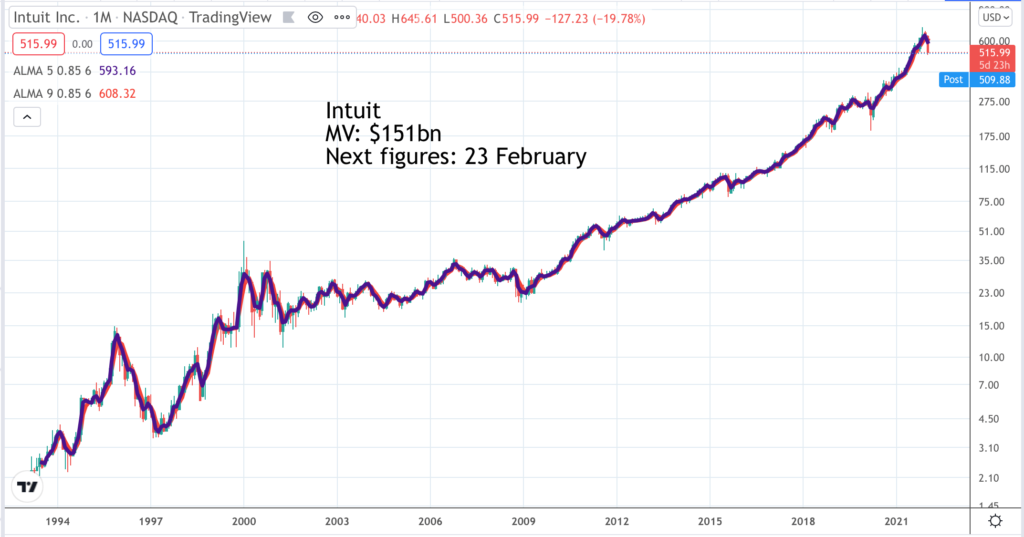
Intuit is another great business that has been reporting great results. Under a new CEO the group has been spreading its wings beyond its accounting software packages for small businesses into areas like helping people find personal loans and most recently its acquisition of Mail Chimp for a consideration exceeding $12bn. Q1 2022 revenue grew 53pc or 22pc excluding the impact of acquisitions. The problem as always after the long run up in share prices is stretched valuations with Intuit trading at 74.4 times expected earnings for the year to 31 July 2022. This is a much higher valuation than the stock has traded on in the past and with holders showing substantial profits it has left the stock vulnerable to selling pressure. The sharp price decline in January is going to trigger a moving averages sell signal while breaking the uptrend line in force since March 2020. There is no sign of any deterioration in the fundamentals but the worry for investors now given the sharp change of mood in the whole market is that good news will only produce a short lived rally while any disappointing news will trigger a sharp sell-off. It’s no wonder that investors are running for cover in such a dangerous market.
Intuitive Surgical. ISRG. Latest price: $264.57
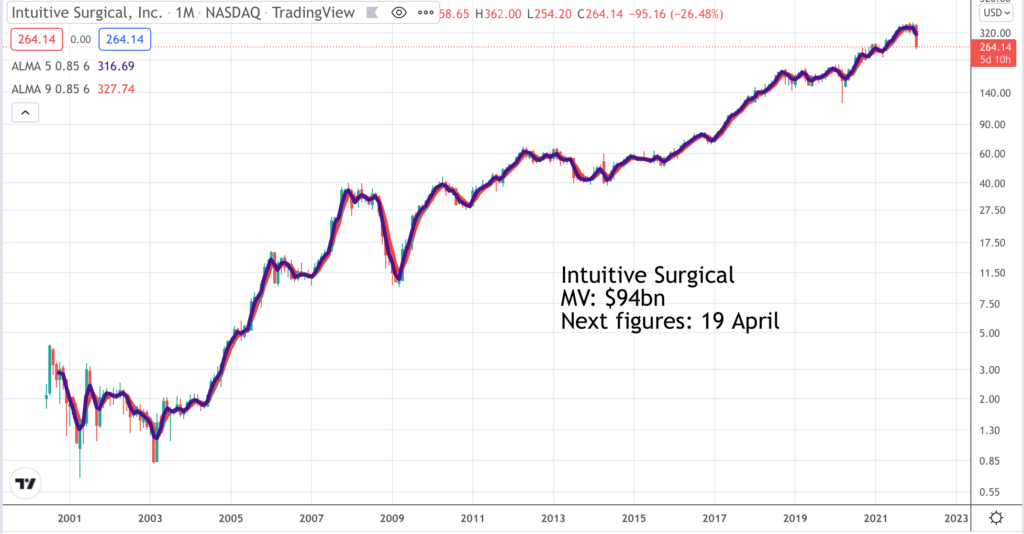
Intuitive Surgical is a highly successful developer and manufacturer of instruments for use in robotic surgery. Each time they develop a robotic system for a new procedure they have to gain FDA approval which builds a huge moat around their business. They also have a razors and razor blades business model. As the installed base of robotic systems grows ever larger they make recurring income from supplying consumables. It is a wonderful business and even after a sharp decline the price has risen some 340 times in the current millennium. There has already been quite a severe correction with the price down 28.6pc from a peak level established as recently as November. It is highly likely that a patient long-term investor would do well by buying at these levels. Nevertheless on Great Charts, bearing in mind that once a decline starts you never know how far it is going to go, we prefer to wait for a new buy signal before buying. All we can say at the moment is that the shares have broken down from a small top area and the moving averages are declining. The shares are still richly valued for a business expected to increase earnings per share by some 50pc over a five year period.
Netflix. NFLX. Latest price: $386.71
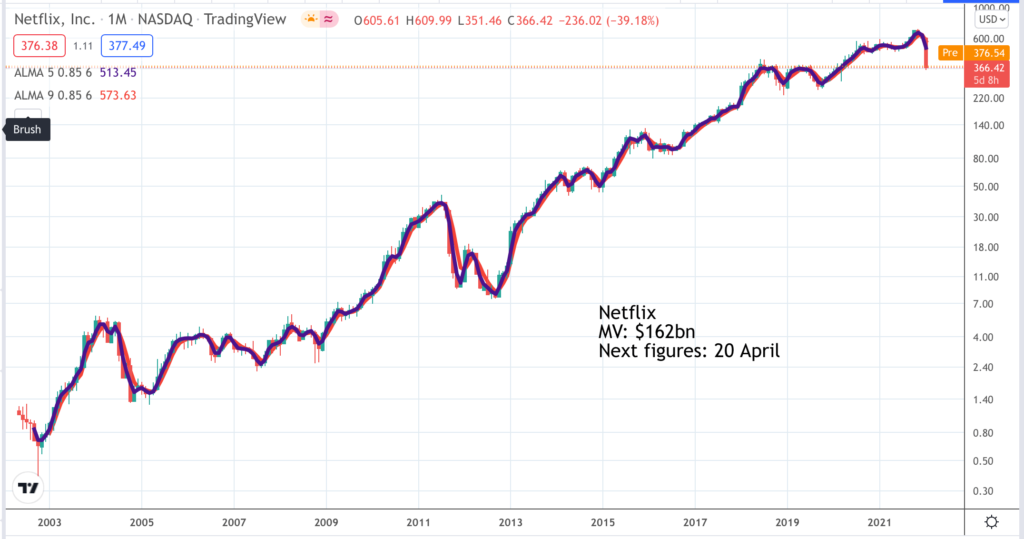
This is what Netflix had to say about their just reported Q4 2021 earnings.
“We achieved several milestones in 2021: we had the biggest TV show of the year (Squid Game), our two biggest film releases of all time (Red Notice and Don’t Look Up) and Netflix was the most Emmy-winning and most nominated TV network and the most Oscar-winning and nominated movie studio of 2021. Full year revenue of $30bn grew 19pc year over year while operating income of $6.2bn rose 35pc year over year. We finished Q4 with 222m paid memberships (with 8.3m paid net adds in Q4). Even in a world of uncertainty and increasing competition, we’re optimistic about our long-term growth prospects as streaming supplants linear entertainment around the world. We’re continually improving Netflix so that we can please our members, grow our share of leisure time and lead in this transition.”
Sounds impressive, doesn’t it. Yet the shares reacted by plummeting nearly 22pc in a day. Among the reasons were a below expectations projection for new subscriber adds in Q1 2022 and a projected fall in operating margins from 20.9pc for 2021 to between 19pc and 20pc for 2022. There are reasons for this including the strengthening of the US$ affecting profits on overseas earnings but still it is disappointing after the margin has steadily increased from 4.3pc in 2016. The company retains its target of increasing margins by three per cent a year over any several year period and still believes it has tremendous room for growth. The shares are brutally oversold but obviously no buy signal yet.
Nio. NIO. Latest price: $21.60
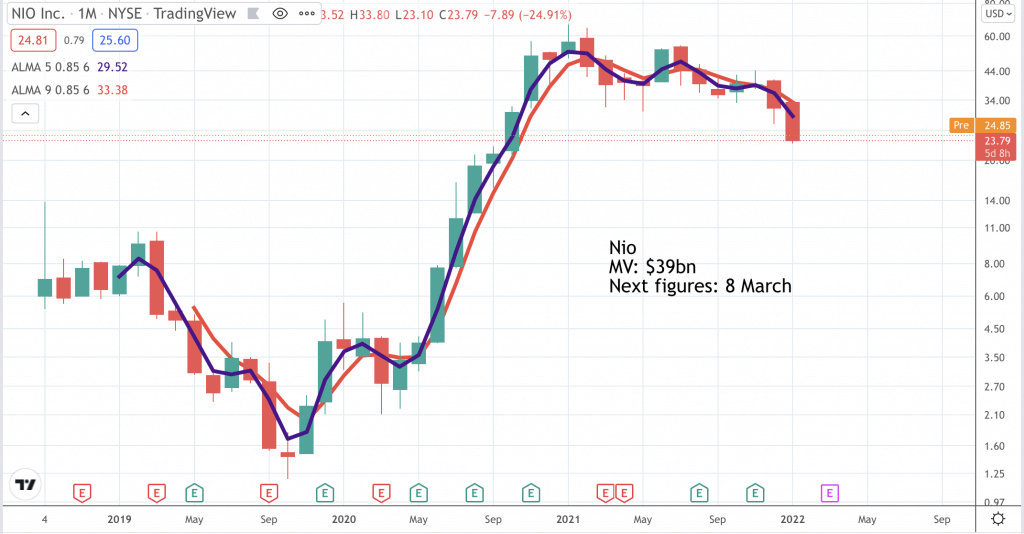
Nio is a fast-growing Chinese electric car company, a Chinese Tesla, if you like. Analysts are projecting sales growing from 5bn renminbi for 2018 to close to 100bn renminbi (around US$15.5bn) by 2023 so very exciting growth. Even so the chart does not look great. The moving averages are falling and the price has broken down below a significant top area. If I knew nothing about the business I would say the share price was headed lower with no important support above $5. If you look back to 2020 and early 2021 you can see what buy signals look like with the share price punching higher out of a large base pattern in June 2020 and the moving averages turning higher. One simple strategy with shares in strong uptrends supported by powerful fundamentals is to aim to be invested while the moving averages are climbing and out while they are falling. This is harder to do than it looks which is why an alternative strategy is never sell and buy more on buy signals. Over the long haul I think the latter strategy works better while the former strategy may be less stressful. At the moment we have sell signals and no buy signals, which is pretty much the case across the stock market. Like the change from bull to bear the change from bear to bull can happen fast for individual stocks and the market as a whole but meanwhile Nio shares look vulnerable.
PayPal Holdings. PYPL. Latest price: $160.08
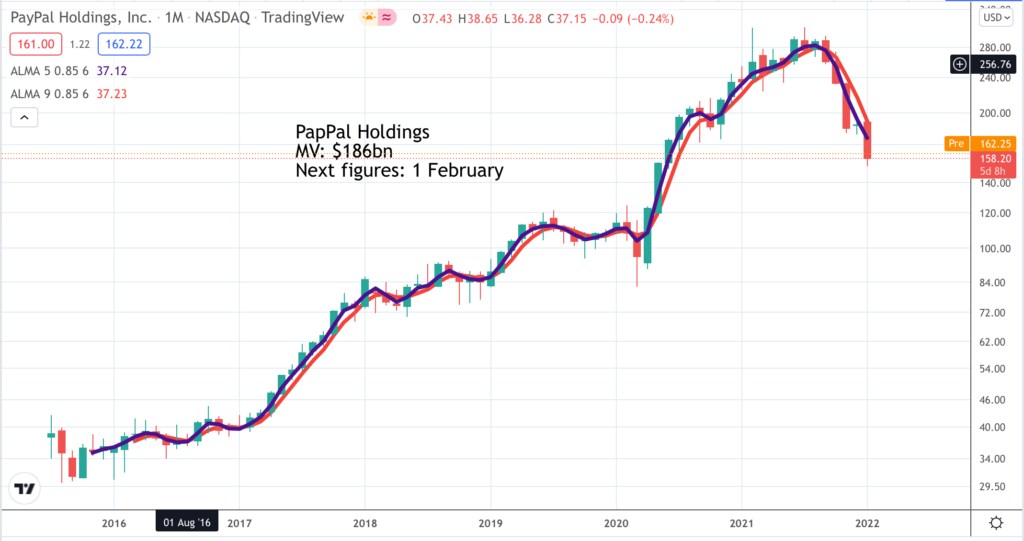
Financial technology shares have been out of favour in recent months after a brilliant period since 2016. As you can see from the chart the shares gave a clear sell signal last October, when it became apparent that the moving averages had turned down and the latest rising trend line had been decisively broken. Now we are waiting for something similar to happen the other way with the downtrend line being broken and the averages turning higher. There is strong support around $100 but remember that a sign of a bear market is that support levels don’t hold. The traditional wisdom about share prices is that 80pc of the price depends on investor sentiment, hence the potential for dramatic swings. Two things happened between 2016 and 2020. The business grew very strongly with sales rising from $10.8bn to $21.4bn which is projected to reach $36.3bn by 2023 and also the business was revalued. Whereas in 2017 PayPal was trading for around four times sales by the peak in 2021 it was trading for around 15 times sales. This gives great scope for share price volatility, especially since nobody has a fixed reference point for the correct ratio of market value to sales, which is a metric which has only come into broad usage relatively recently. What we can say is that the recent sharp fall in the share price is rapidly bringing the relationship back to where it was in 2017 so the share price is looking more strongly underpinned by the fundamentals. What we now need to see is more positive action by the share price leading to buy signals.
ServiceNow. NOW. Latest price: $533.43
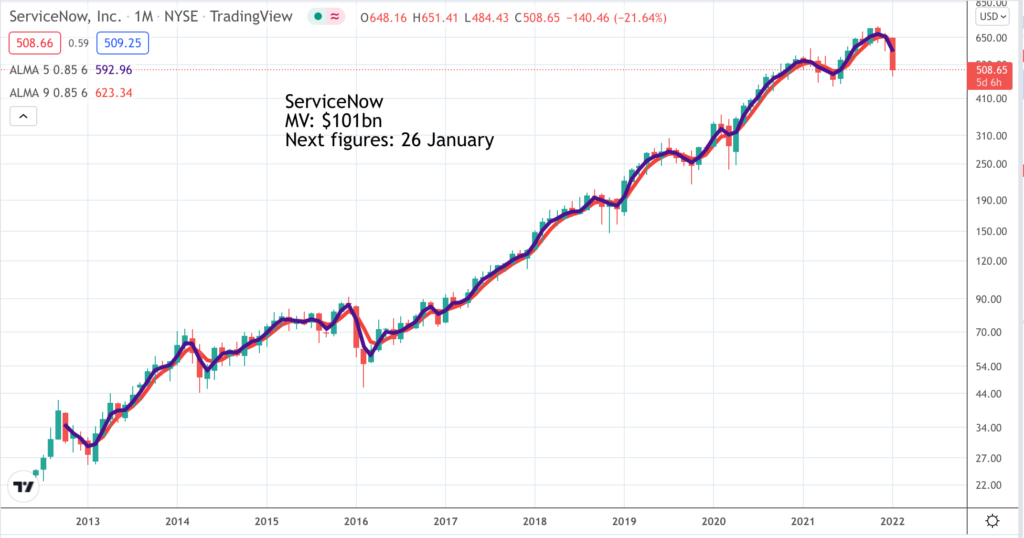
I am writing this just before ServiceNow is due to report its Q4 2021 earnings so whatever they have to say will determine the short term price action. They have now reported great results triggering an 11.5pc jump in the share price. This is what CEO, Bill McDermott, said:-“ServiceNow is uniquely positioned. We’re growing like a fast-moving start-up with the profitability of a global market leader. We’re on a clear growth trajectory to $15bn plus by 2026. While our strong cash position preserves optionality, we don’t depend on M&A for growth. While rising interest rates challenge others, ServiceNow’s business model is built to flourish in any economic environment. We are not opportunity constrained as our customers’ need for digital transformation is ever expanding. Our organic growth machine is in full flight, and our pipeline is stronger than ever.” Like others mentioned in this issue ServiceNow is a fabulous company, classic 3G with a great business model, great leadership and huge opportunities to grow its business globally. The negative is that the short-term price action is not good and the shares have had a fantastic run over the last nearly 10 years, rising 32 times trough to peak. This rise has been supported by digital transformation formation, a market in which ServiceNow plays a key role, by work from home and by the proliferation of ETFs and private investors pouring money into high momentum growth shares like ServiceNow. Shares cannot climb the whole time, especially if the price is rising faster than sales and profits. In 2012 NOW had sales of $244m. Analysts are forecasting sales of $9.2bn for 2023, an increase of nearly 39 times, which is actually pretty amazing. The short term chart looks negative but it is hard not to feel that the minute it does look good these shares will be a strong buy. Since 2012 there have been seven major buy signals. We are now waiting for buy signal number eight but not to be anticipated. While shares are falling you never know how far they are going to fall.
Shopify. SHOP. Latest price: $849.50
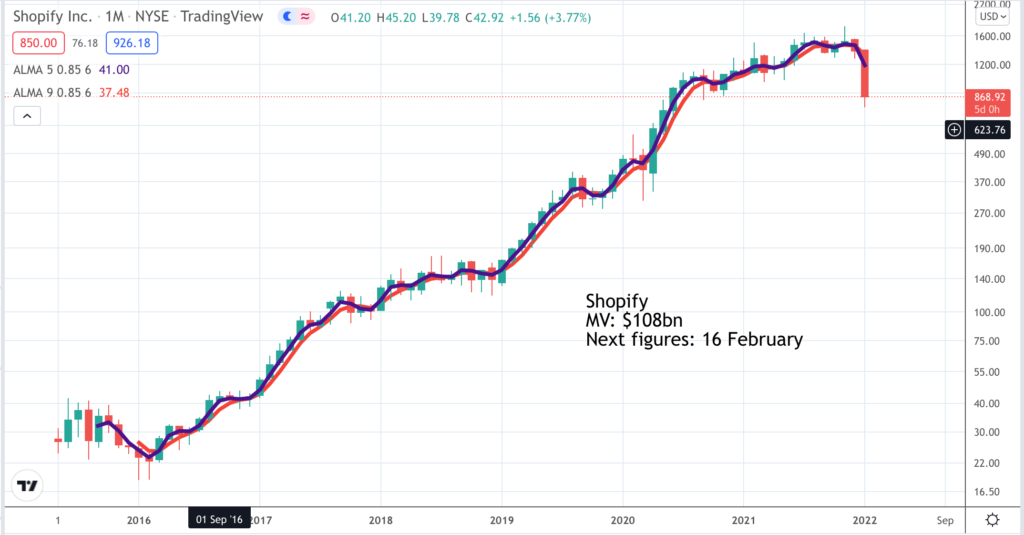
Shopify shares have given every kind of sell signal. They have broken the latest uptrend line, the moving averages are falling and they have broken below an upward sloping top area. They are currently testing support but if that breaks the next support level is around $500 and as we know support levels are not to be trusted in bear markets. Part of the problem has been disquieting reports about Shopify’s plans for its fulfilment network. “Shopify is slashing its fulfillment network capacity by canceling contracts with partners or reducing their scope, Business Insider reported Friday, citing executives at four fulfillment companies. Two fulfillment partners said that the e-commerce company’s capacity to pack and ship orders for merchants is expected to halve once the changes take effect.” It is hard not to be influenced by the fundamentals when looking at a chart. Shopify is a terrific business but nevertheless the chart looks alarmingly like a breakdown pointing to further weakness ahead. The problem with a chart like this is that the shares can rally strongly yet still end up looking weak. The safest course is to avoid them until we have clear evidence of a change of direction.
Snowflake. SNOW. Latest price: $249.57
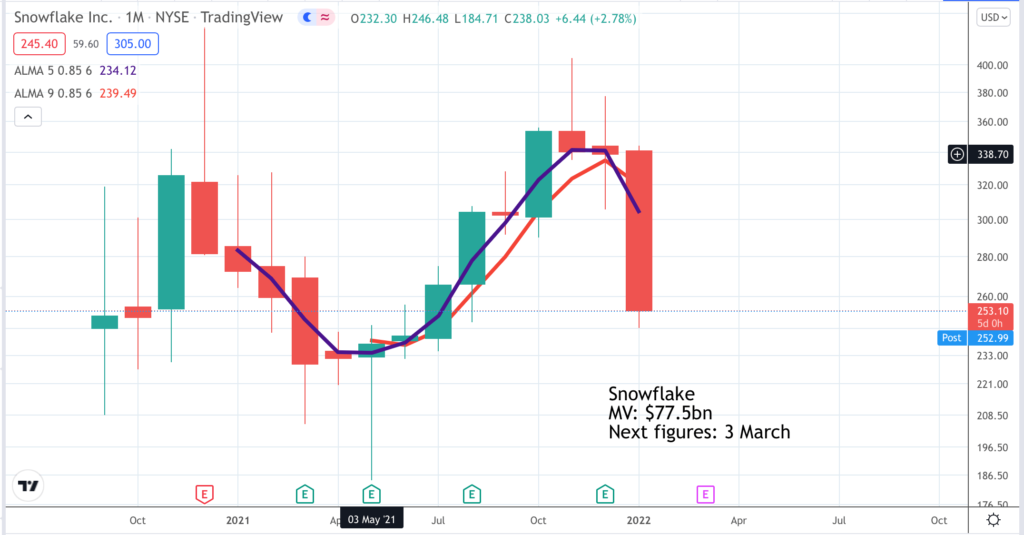
Snowflake is a key player in the explosive fast growing data market. Sales are on a spectacular upwards trajectory, expected top grow from $265m for the year to 31 January 2020 to $3.145bn for the year to calendar 2024. CEO, Frank Slootman, has even been hinting that growth could accelerate in coming years. The problem, as so often in current market conditions is valuation. Even after the recent steep fall the shares are valued at around 25 times sales expected for 2023-24 and the group is nowhere near profitability. It may look as though they are trading close to the September 2021 IPO price but that is a little misleading. Sentiment towards hot growth shares was on fire in the autumn of 2021 so that Snowflake, which was originally set to be priced at $75 for the IPO finally priced at $120, began trading at $245 and rapidly shot to a peak around $420 where the business was valued at a staggering $128bn in a year when sales were going to hit $1.2bn. Snowflake is a wonderfully exciting business but everything has a price. It is not surprising that the shares are seeing selling. In October 2018 the group was valued in a fund raising at $3.5bn. This is clearly one to watch and they are currently oversold but the moving averages are falling and there may be much to-ing and fro-ing to come before they are ready to break higher.
Nasdaq 100. Latest level: 14,182
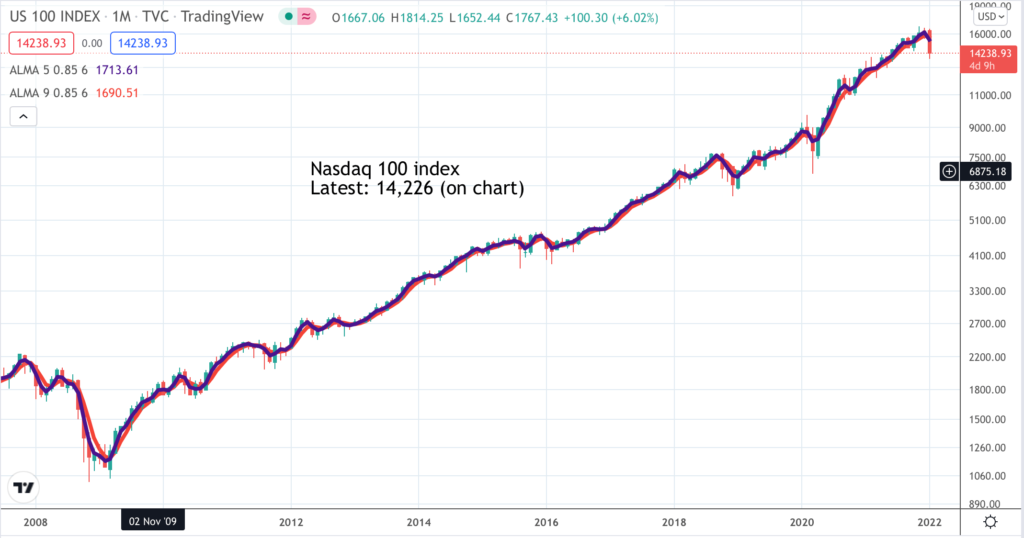
This is a chart of the Nasdaq 100 index. It is hardly a bear market but it does look like a break down. There have been a number of similar moves since the latest bull run began in 2009 but this one feels a little more serious to me mainly because so many individual shares are showing breakdowns. The Nasdaq 100 is acting more like a lagging indicator. I don’t know if, after numerous short lived corrections we are now heading into a more long-drawn out bear market but I do feel it is a possibility. Some tech shares are feeling the pinch as we come out of lockdown, others like ServiceNow (see above) are as gung-ho as ever but it is often like that when a market is on the turn. If there was a chorus saying business is getting tougher the index would plummet. The problem is that the index has just broken its latest uptrend line and the moving averages have just made a dead cross (shorter average crossing below a falling longer average) suggesting that this period of weakness is still early days, at least in time terms. Investors have had a shock and may take time to regroup. One warning sign is what has happened to a whole slew of shares in fast-growing Chinese companies which have been in a steep decline for almost a year and still look weak. The moving averages turned down around last March and have declined steadily ever since. It shows what can happen.
O’shares Global Internet Giants. OGIG. Latest price: $38.81
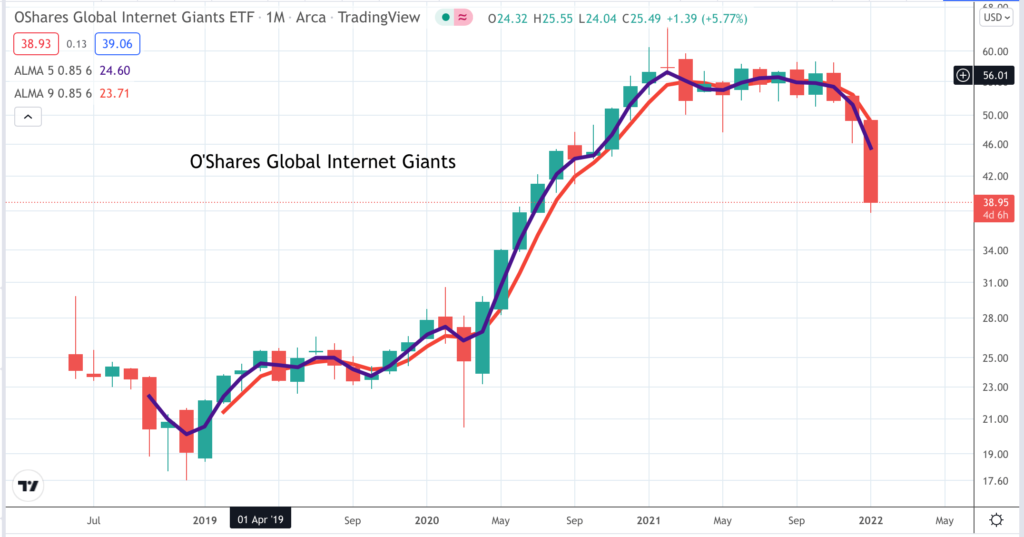
This is what we are dealing with in chart terms. OGIG has a classic portfolio of shares in fast-growing technology companies including some Chinese names. It peaked in February 2021, consolidated for around a year and then broke down. It could have broken up but it didn’t. It is now in a full-on bear market trend. Any attempt to buy these shares would be a classic example of trying to catch a falling knife, somethings investors are always advised not to do. There will be rallies, some of which may be sharp but I don’t think this share is going to turn around easily. I think it now needs to build a base and break higher from that to establish a new uptrend. For sure it will happen one day but in the meantime we are in what looks like an uncompleted downtrend.
iShares Edge World Momentum. IWMO Latest price: $60.30
Again with this chart we have a broken uptrend and declining moving averages. This has happened before, most notably in March 2020 when shares fell sharply and rebounded with spectacular force. I am not expecting that to happen this time. In March 2020 the big realisation was that lockdown was going for technology as it turbocharged an already happening move to e-commerce and digital transformation. This time, as we come out of lockdown, the turbos are working the other way if anything, there is nervousness about how the investment world will react if interest rates move higher as inflation picks up and economies recover, there are worries about a property bubble in China and the rising tension between the Ukraine and a gangster-led Russia. IWMO has a classic blue chip high tech portfolio with almost a quarter of the fund in Apple, Microsoft, Tesla, Nvidia and Alphabet. There has been a clear loss of momentum. They are testing support at $60 but support does not mean much in a bear phase. This is one to watch and wait.
Vanguard Russell 2000 VTWO. Latest price: $78.23
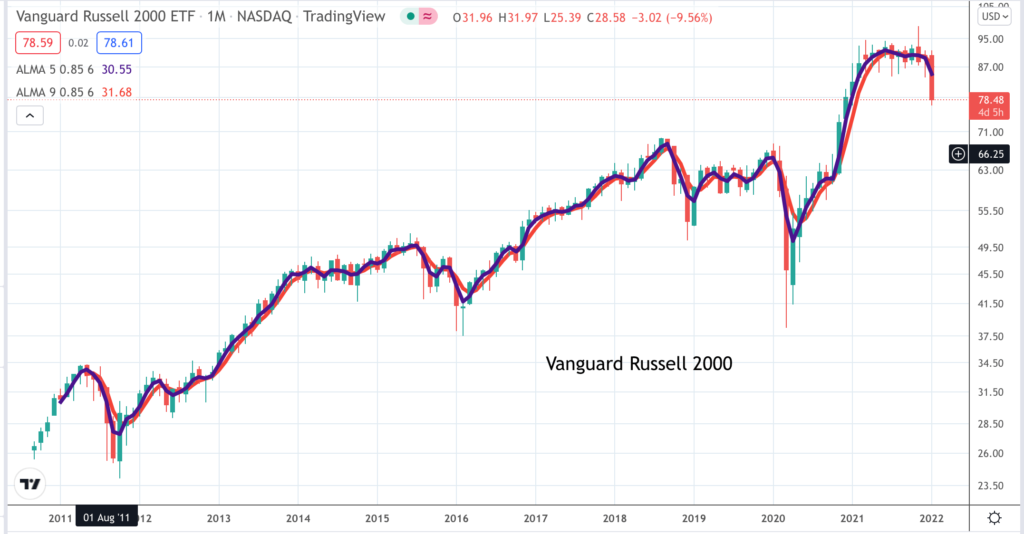
The Russell 2000 index, which is tracked by this ETF, consists of the 2000 smallest US-quoted companies considered suitable for institutional investors. The big ones are in the Russell 1000 and all added together they make up the Russell 3000. The Small Caps ETF/ index has broken down out of a top area and is now in a clear bear phase. This is usually an indicator that some kind of economic slowdown lies ahead because that is always a negative development for small caps. The implication might be that we are going to see a vigorous post-lockdown economic recovery followed by higher interest rates to take the steam out of the recovery followed by a slowdown and shares are already starting to discount this sequence of events.
S&P 500 SPX Latest: 4,357

Looking at this chart you can see why it can be so hard to predict from the indices what is going to happen next. There have been numerous occasions since the bull market began in 2009 when shares haver tumbled on profit-taking only to recover and see the bull trend resume. Broadly speaking that is what I expect to happen this time but my reading of the charts of all the individual shares in my Quentinvest tables makes me think that this setback may be deeper and longer-lasting than other setbacks seen over recent years. It seems, with the benefit of hindsight, that valuations in the summer and autumn of 2021 reached an unsustainable level pointing to a peak in investor enthusiasm. Put another way, investor sentiment, which has been improving steadily since 2009 topped out last autumn and we just do not know how far investors need to cool down before they can start to become excited all over again. My worry is that the example of the badly battered Chinese shares is going to be followed to some extent by the US market. There is also the problem that CEOs become infected with the excitement too and have been whipping investors into a frenzy about the exciting prospects ahead for their companies. It may even be significant that after years of saying he would never, ever sell his Tesla shares Elon Musk since November has sold $16.4bn worth. Whatever his reasons he has done something he said he was never going to do and it may be significant that another Tesla super bull, Cathie Wood of ARK Investment has been selling too.

Incredible Chart/ Fundamentals for Advanced Micro Devices (AMD)

Who’s A Scaredy-Cat!

Stunning Micron Results Keep Memory Boom At Full Throttle