This chart shows a pattern called an extended V reversal. The extension is the sideways trading on the left of the V and then comes the V with the price dropping sharply and rising as fast as it fell. It is a bullish pattern . The Coppock indicator has been rising since October 2022.
KWEB has a great list of holdings
I have been greatly tempted and in line with my rules are made to be broken philosophy have already bought two tranches of stock. This is a classic 3/3 and I am not sure how relevant the US indices are to these Chinese stocks. Some like Futu Holdings, which again looks interesting, would benefit from a rising US stock market but otherwise the Chinese stocks seem to plot their own course, responding to developments in China. I don’t think this is a bad thing. There are 1.4bn people in China and they are getting richer all the time. The leader Xi also finally seems, willingly or unwillingly, to be behaving a little more pragmatically, which should also favour a more favourable environment for the shareholder capitalism which has made America so rich.
In some ways looking at the KWEB chart and this portfolio I wonder if we need to bother with holdings in individual Chinese technology shares but Netease has a phenomenal track record and looks interesting. The chart scores 3/3 on the technicals rising to 6/6 with KWEB where Netease is one of the largest holdings.

Netease is mainly about content creation for video games. This month it announced the acquisition of SkyBox Labs, a Canada based content creator which has worked on much loved games such as Halo Infinite, Minecraft (even I have heard of that one) and Fallout 76. It also has majority control of two important quoted companies, Youdao (NYSE: DAO) and Cloud Music (HKEX: 9899), the first of which in an intelligent learning business and the second is online music content. Both have promising charts.
Netease launched their first video game in 2001 and shortly thereafter the shares began their meteoric rise.
We launched our first PC based MMORPG, Westward Journey Online, in December 2001. Subsequently, we launched Westward Journey Online II in August 2002 and our second original PC based MMORPG, Fantasy Westward Journey, in January 2004. Westward Journey Online II and Fantasy Westward Journey were upgraded to New Westward Journey Online II and Fantasy Westward Journey Online in 2013. Both game series remain popular with gamers today as a result of continued content updating and innovation in play modes over the past two decades. Most recently, we launched our action battle royale game, Naraka: Bladepoint, which was well received by players with great success and named a “Top Seller” on Steam’s Best of 2021 games list.
PC game players can purchase prepaid points to pay for game playing time, virtual items and other fee-based services that enhance their playing experience such as special powers, costumes, weapons and other accessories. We regularly introduce new virtual items and other fee-based services, as well as change the features of virtual items based on player feedback, market trends and other factors.
Annual report 2021
The group also licenses games from other international developers but in 2021 these accounted for less than 10pc of revenue. The group is also expanding internationally and in mobile games.
We continue to advance our games and make inroads that expand our reach in overseas markets. We have launched more than 50 mobile games in global markets since 2015. Our mobile game, Knives Out, has remained popular in Japan since its launch in 2017 and topped Japan’s iOS grossing chart multiple times in 2021. Identity V, which we launched in Japan in 2018, and LifeAfter, which we launched in Japan in 2019, were also ranked in Japan’s iOS grossing chart multiple times in 2021 further evidencing our potential to operate a diverse range of games in overseas markets over the long term.
In addition to our success in Japan, we have expanded our footprint across more regions. In December 2019, we launched MARVEL Super War in several Southeast Asian markets where it topped many of the iOS download charts. In 2020, we also introduced EVE Echoes and MARVEL Duel to overseas markets. In 2021, we launched The Lord of the Rings: Rise to War in Europe, the Americas, Oceania and Southeast Asia. We have also further enhanced our global R&D capabilities by launching a video game studio in Canada in 2019 and opening our Sakura Studio in Japan in 2020.
Annual report 2021
This success is underpinned by the group’s training programmes.
We strive to recruit and grow the best talent in the industry. Our training programs at NetEase Games Academy are widely recognized in China as a premier online games training institution for creative minds. We were awarded the 2021 ATD BEST Award by the Association for Talent Development, one of the most authoritative international awards in the global talent development industry. In addition, we established our in-house game AI research institutions to focus on researching big data, user persona, reinforcement learning, computer vision and graphics, natural language processing, speech synthesis and music generation. Having built a virtuous cycle among our talent, established development pipeline and dynamic culture of innovation and craftsmanship, our strong R&D capabilities continue to enable high-quality production and expansion of successful games.
Annual report 2021
They also have great technology.
In addition to game development, we have continually invested in proprietary game engine R&D. Since the initial launch of our first game engine, NeoX, in 2005, we have continually expanded and optimized our proprietary engines to systematically support enhanced game features and aesthetics. As part of our early strategy to focus on mobile games, we successfully adapted NeoX to iOS and Android systems as well as developed Messiah, a 3D game engine specifically designed for mobile platforms. We believe that our R&D in game engines and games reinforces each other and promotes a virtuous cycle of innovation. NeoX and Messiah enable us to systematically develop mobile games with the highest quality in lighting, audio, special effects, physics and animation, and other key game features, while our drive for better games in turn motivates development of more powerful engines.
Annual report 2021
It is obvious that Netease is an amazing company, definitely 3G, and the chart suggests the timing is ripe to start building a stake. Latest results were solid.
“Steady growth characterized our third quarter, generating total net revenues of RMB24.4bn, an increase of 10.1pcwhat is the Fed Pivot
year-over-year. Our games business continues to see solid gains. Beloved flagship titles such as our Fantasy Westward Journey sagas further grew in the third quarter, impressing the industry with their strength and longevity. The successful launch of thrilling new games such as Diablo® ImmortalTM is a further testament to our robust R&D programs and ability to captivate the attention of players in the international arena.”
In addition to our games, we maintained our differentiated offerings with Youdao, Cloud Music and Yanxuan businesses. As we move forward, we will continue to leverage our innovative content and services to drive sustainable growth across each of our carefully cultivated businesses.
William Ding, CEO and co-founder, Q3 2023, 17 November 2022
What was impressive about the Q3 earnings to end September 2022 was the earnings beat.
In the September quarter 2022, NetEase operating profit jumped by 25.6pc year over year as compared to Q3 2021, to $667m. Even more notably, net income attributable to shareholders increased by 110.6pc, as cost discipline pushed NetEase profit margin to 23.12pc. As a consequence, EPS was recorded at $1.58/ ADS, which is 53 cents higher than what analyst consensus had expected (50% beat).
Seeking Alpha, 23 December 2022
The shares look good value but it would be nice to see an important ‘something new’ to really make them exciting. Nevertheless they are a buy on the chart.
Netease NTES Buy @ US$88
Strategy
I just found this interesting quote.
The Fed pivot is likely coming, and our most prominent tech companies should have epic rebounds from the bear market lows.
We also see inflation coming down substantially, and the economy continues slowing during this tightening process. Next, the Fed could pivot to a more dovish stance and possibly return to easing before 2023 ends. Stocks should bottom well before then, and we could see the next bull market begin sometime in Q1 2023.
Tech was the leading segment in the robust bull market leading up to its 2021 peak. Then, as the epic drop became a reality, technology stocks got obliterated in 2022. The downturn even dragged the best and brightest companies to highly oversold levels. Significant opportunities in our favorite tech stocks for the next bull market are here now and could increase in Q1 2023. While we could see more volatility in the coming months, there is likely limited downside in quality big-cap tech stocks. Moreover, the best-quality tech names will likely become the leaders in the next bull run.
The Financial Prophet, 30 December 2022
The above is an analysis based on fundamentals. What is striking is how well this ties in with my technical analysis which points to a new bull market starting in the first quarter of 2023.
A Fed Pivot is a change in monetary policy by the Federal Reserve. The last one occurred in the beginning of 2022 when the Fed switched from an easy money policy to monetary tightening and higher interest rates. As one commentator notes.
A Fed pivot is an event which can have a tremendous impact on financial markets create opportunities to make money or resulting in huge losses for investors.
Tomorrow MAKERS, 24 November 2022
One classic way to take advantage and position yourself for this rebound is my favourite leveraged ETFs, QQQ3, SOXL, SPXL and TECL, all of which can presently be bought in IG share accounts. I am presently holding SOXL and TECL at low average entry prices and will probably be tempted back into QQQ3 because of the spectacular way in which it amplifies returns on the Nasdaq 100.
Cryptos wake up
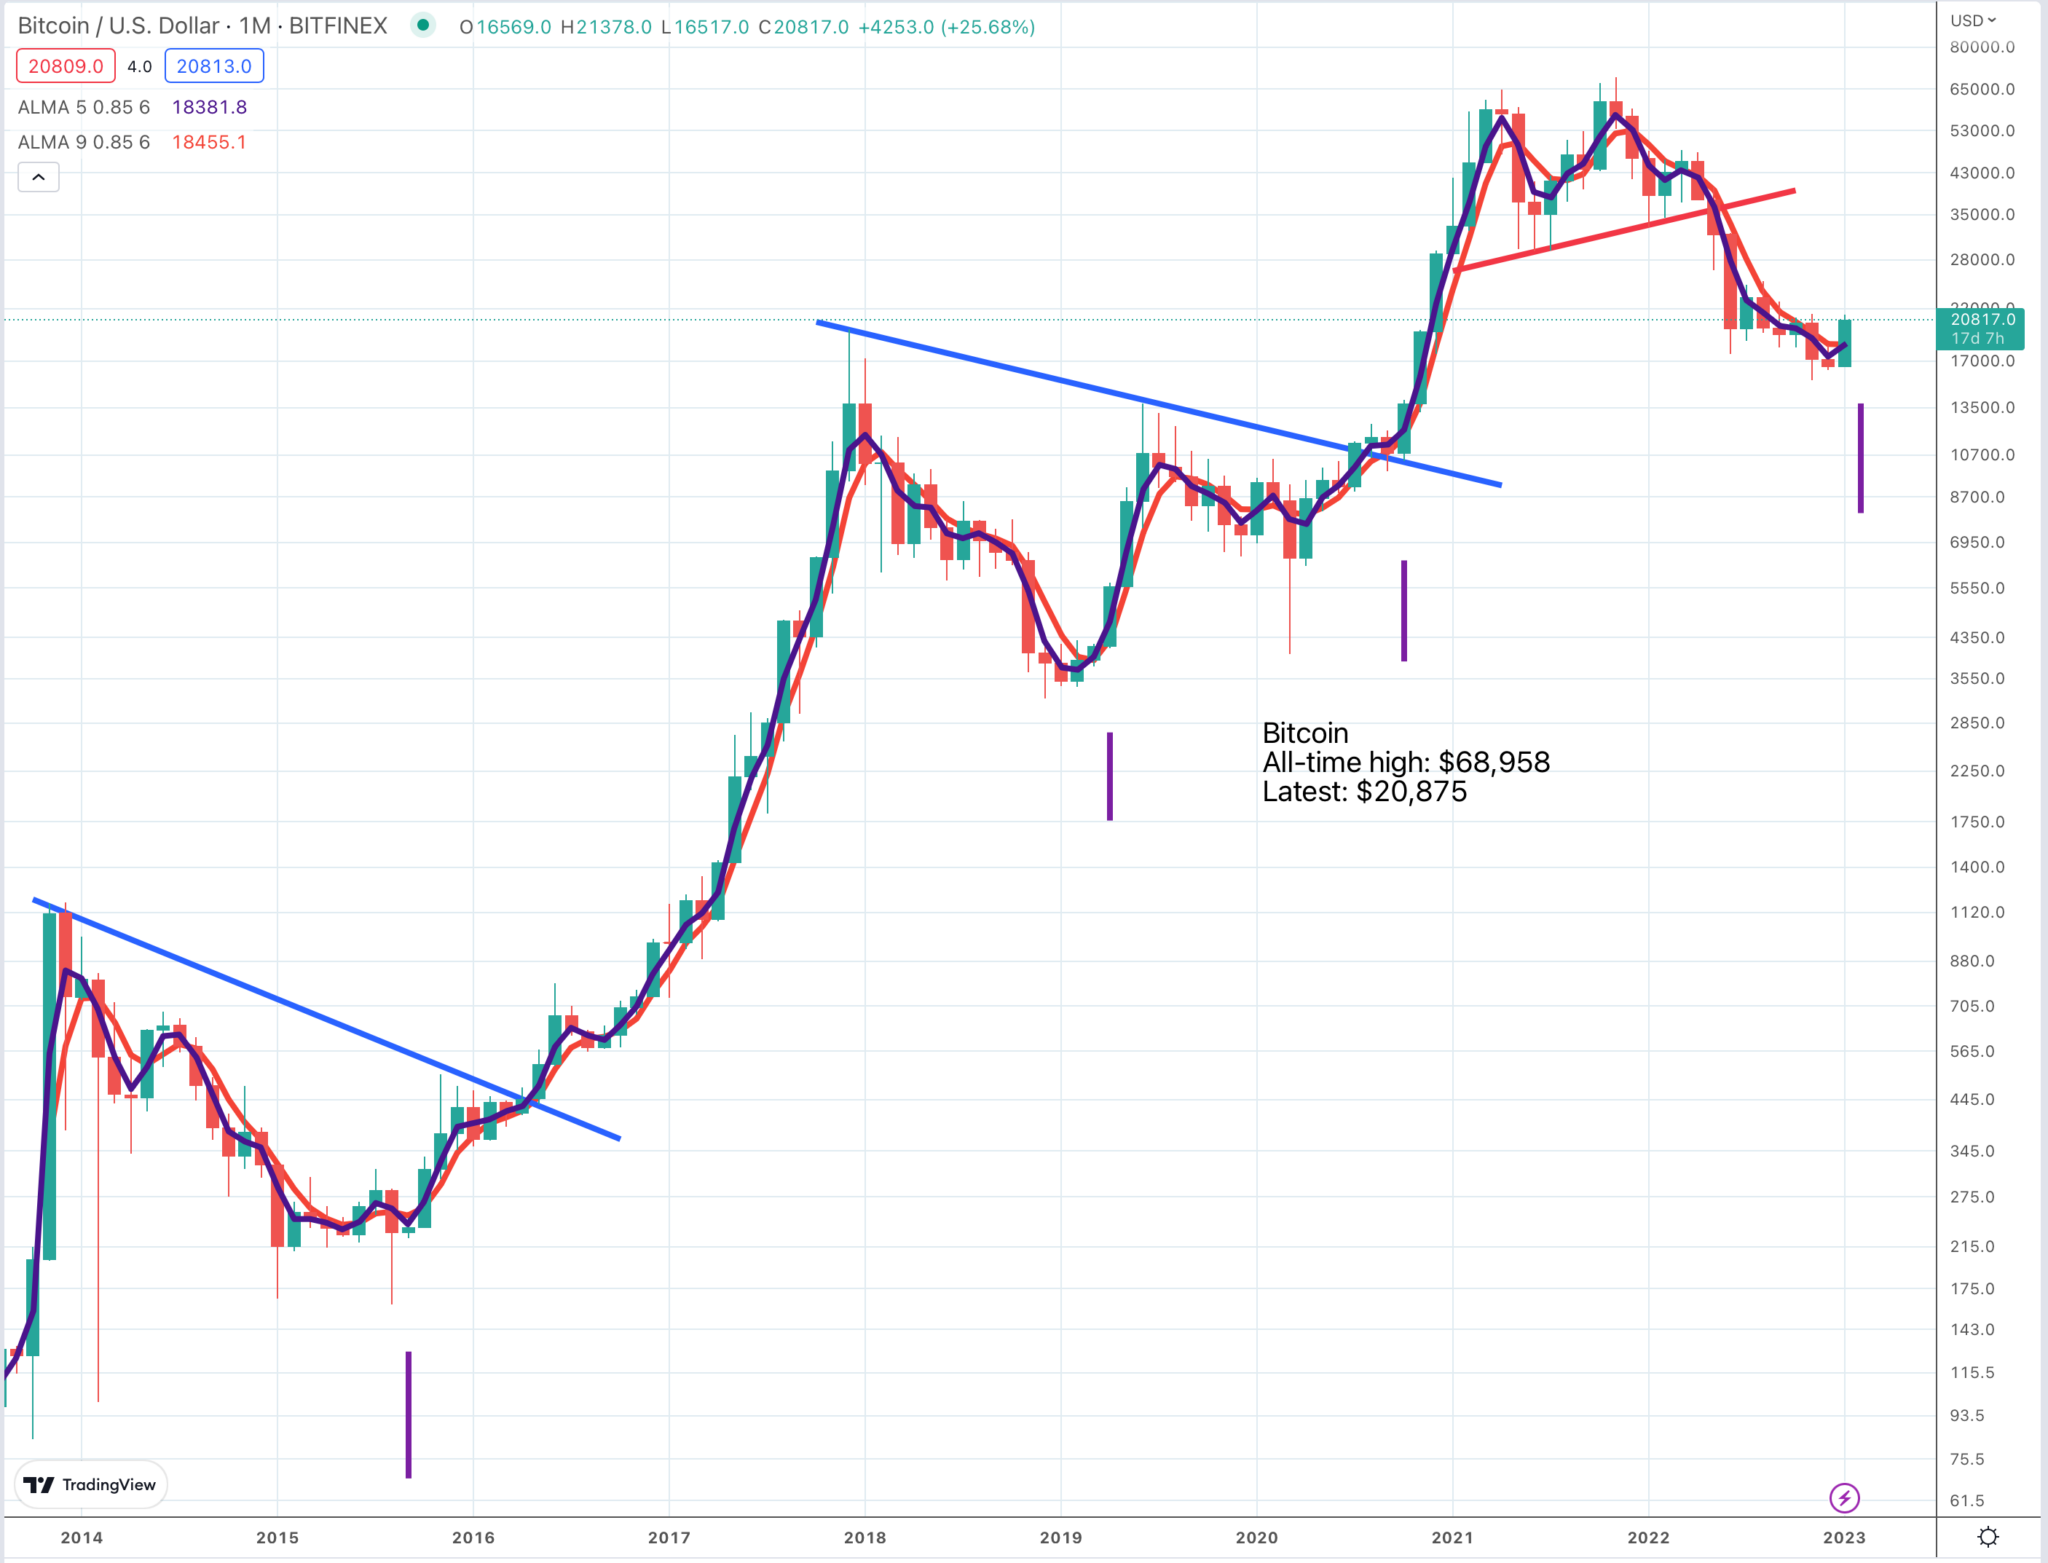
Another investment instrument that has woken up dramatically in recent days is bitcoin. In the pattern below there are the makings of a bear trap. The price broke down from a pattern but has reversed and moved dramatically higher.
What is even more significant is what is happening with Coppock. I have marked four buy signals on the chart. The first three are history, the fourth is due to happen in February 2023. The historical three were dramatically successful. Could signal four go the same way; that would be exciting if it does and have implications across the board for all sorts of risk-on investments.
I was talking yesterday with my much younger brother who retired at 50 after a successful career as a bond dealer at Merrill Lynch. He now makes his living developing properties and enjoys an enviable life style. One of his investment rules, he told me, is that whenever it feels as though the world is coming to an end that is the time to buy, that moment when you feel least like buying and vice versa for selling.
It is a wonderful rule but so hard to apply. In December bitcoin looked like a suicidal investment. Maybe that was the time to buy.
Unfortunately you can no longer buy bitcoin on IG so I need to find a proxy. The obvious one seems to be Coinbase, which operates as a cryptocurrency exchange platform and floated in April 2021 since when bitcoin has lost 68pc of its value. Coinbase has done even worse, down 88pc. It seems a good bet that if bitcoin does well Coinbase will do well too, most likely even better. Whereas bitcoin has rallied 25pc in January Coinbase is up 59pc from its low point. I am not going to go into a huge amount of detail but below gives an idea of what Coinbase does.
We build safe, trusted, easy-to-use technology and financial infrastructure products and services that enable any person or business with an internet connection to discover, transact, and engage with crypto assets and decentralized applications. Our products provide access to the cryptoeconomy in more than 100 countries and serve as a critical infrastructure layer to Web3.
Customers that start with us grow with us as they experience the benefits of crypto-based products for investing, staking, spending, borrowing and transacting in crypto in a growing number of use cases. Today, our platform enables approximately 89m retail users, 11,000 institutions, and 210,000 ecosystem partners to engage with crypto assets:
Annual report, 2021
This is serious boffin stuff
We have deep expertise in real-time distributed computing, novel consensus mechanisms, smart contracts, cryptography, and native blockchain integrations that allow us to nimbly adapt to shifting trends and innovate with the industry. We have invested heavily in the scarce talent required to safely power the cryptoeconomy and employ teams dedicated to blockchain research, operations, and development to support the growth of the industry.
Annual report 2021
A key point about Coinbase is that it is a crypto blue chip. The latest financial year, 2022, has been a tough one but the company still has net cash over $2bn. In response to the tough 2022 Coinbase has cut 25pc of its workforce so if things do pick up profits and free cash flow should climb steeply.
One thing I like about the shares is that it has been all downhill since the IPO so the company has never known a bull market. If conditions improve there are going to be no sellers but many buyers of the shares, which could squeeze them sharply higher. Also interesting is that there is a large short position in Coinbase. Back in the day Tesla was a heavily shorted stock and we know what happened to them.
Ether also looks interesting
Ether also has an interesting chart. There is no breakout yet but like bitcoin ether’s Coppock indicator is poised to turn higher next month, which would make an upside breakout very interesting.

Before the great crash I had a rule that if a stock was mentioned in one of my publications it was a recommendation. During 2022 that rule was abandoned or suspended. I think I am going to reinstate it for 2023. If I mention a stock, crypto or whatever unless the context is clearly bearish it is a buy recommendation. This will make it easier for me when I come to assess performance.

Incredible Chart/ Fundamentals for Advanced Micro Devices (AMD)

Who’s A Scaredy-Cat!

Stunning Micron Results Keep Memory Boom At Full Throttle