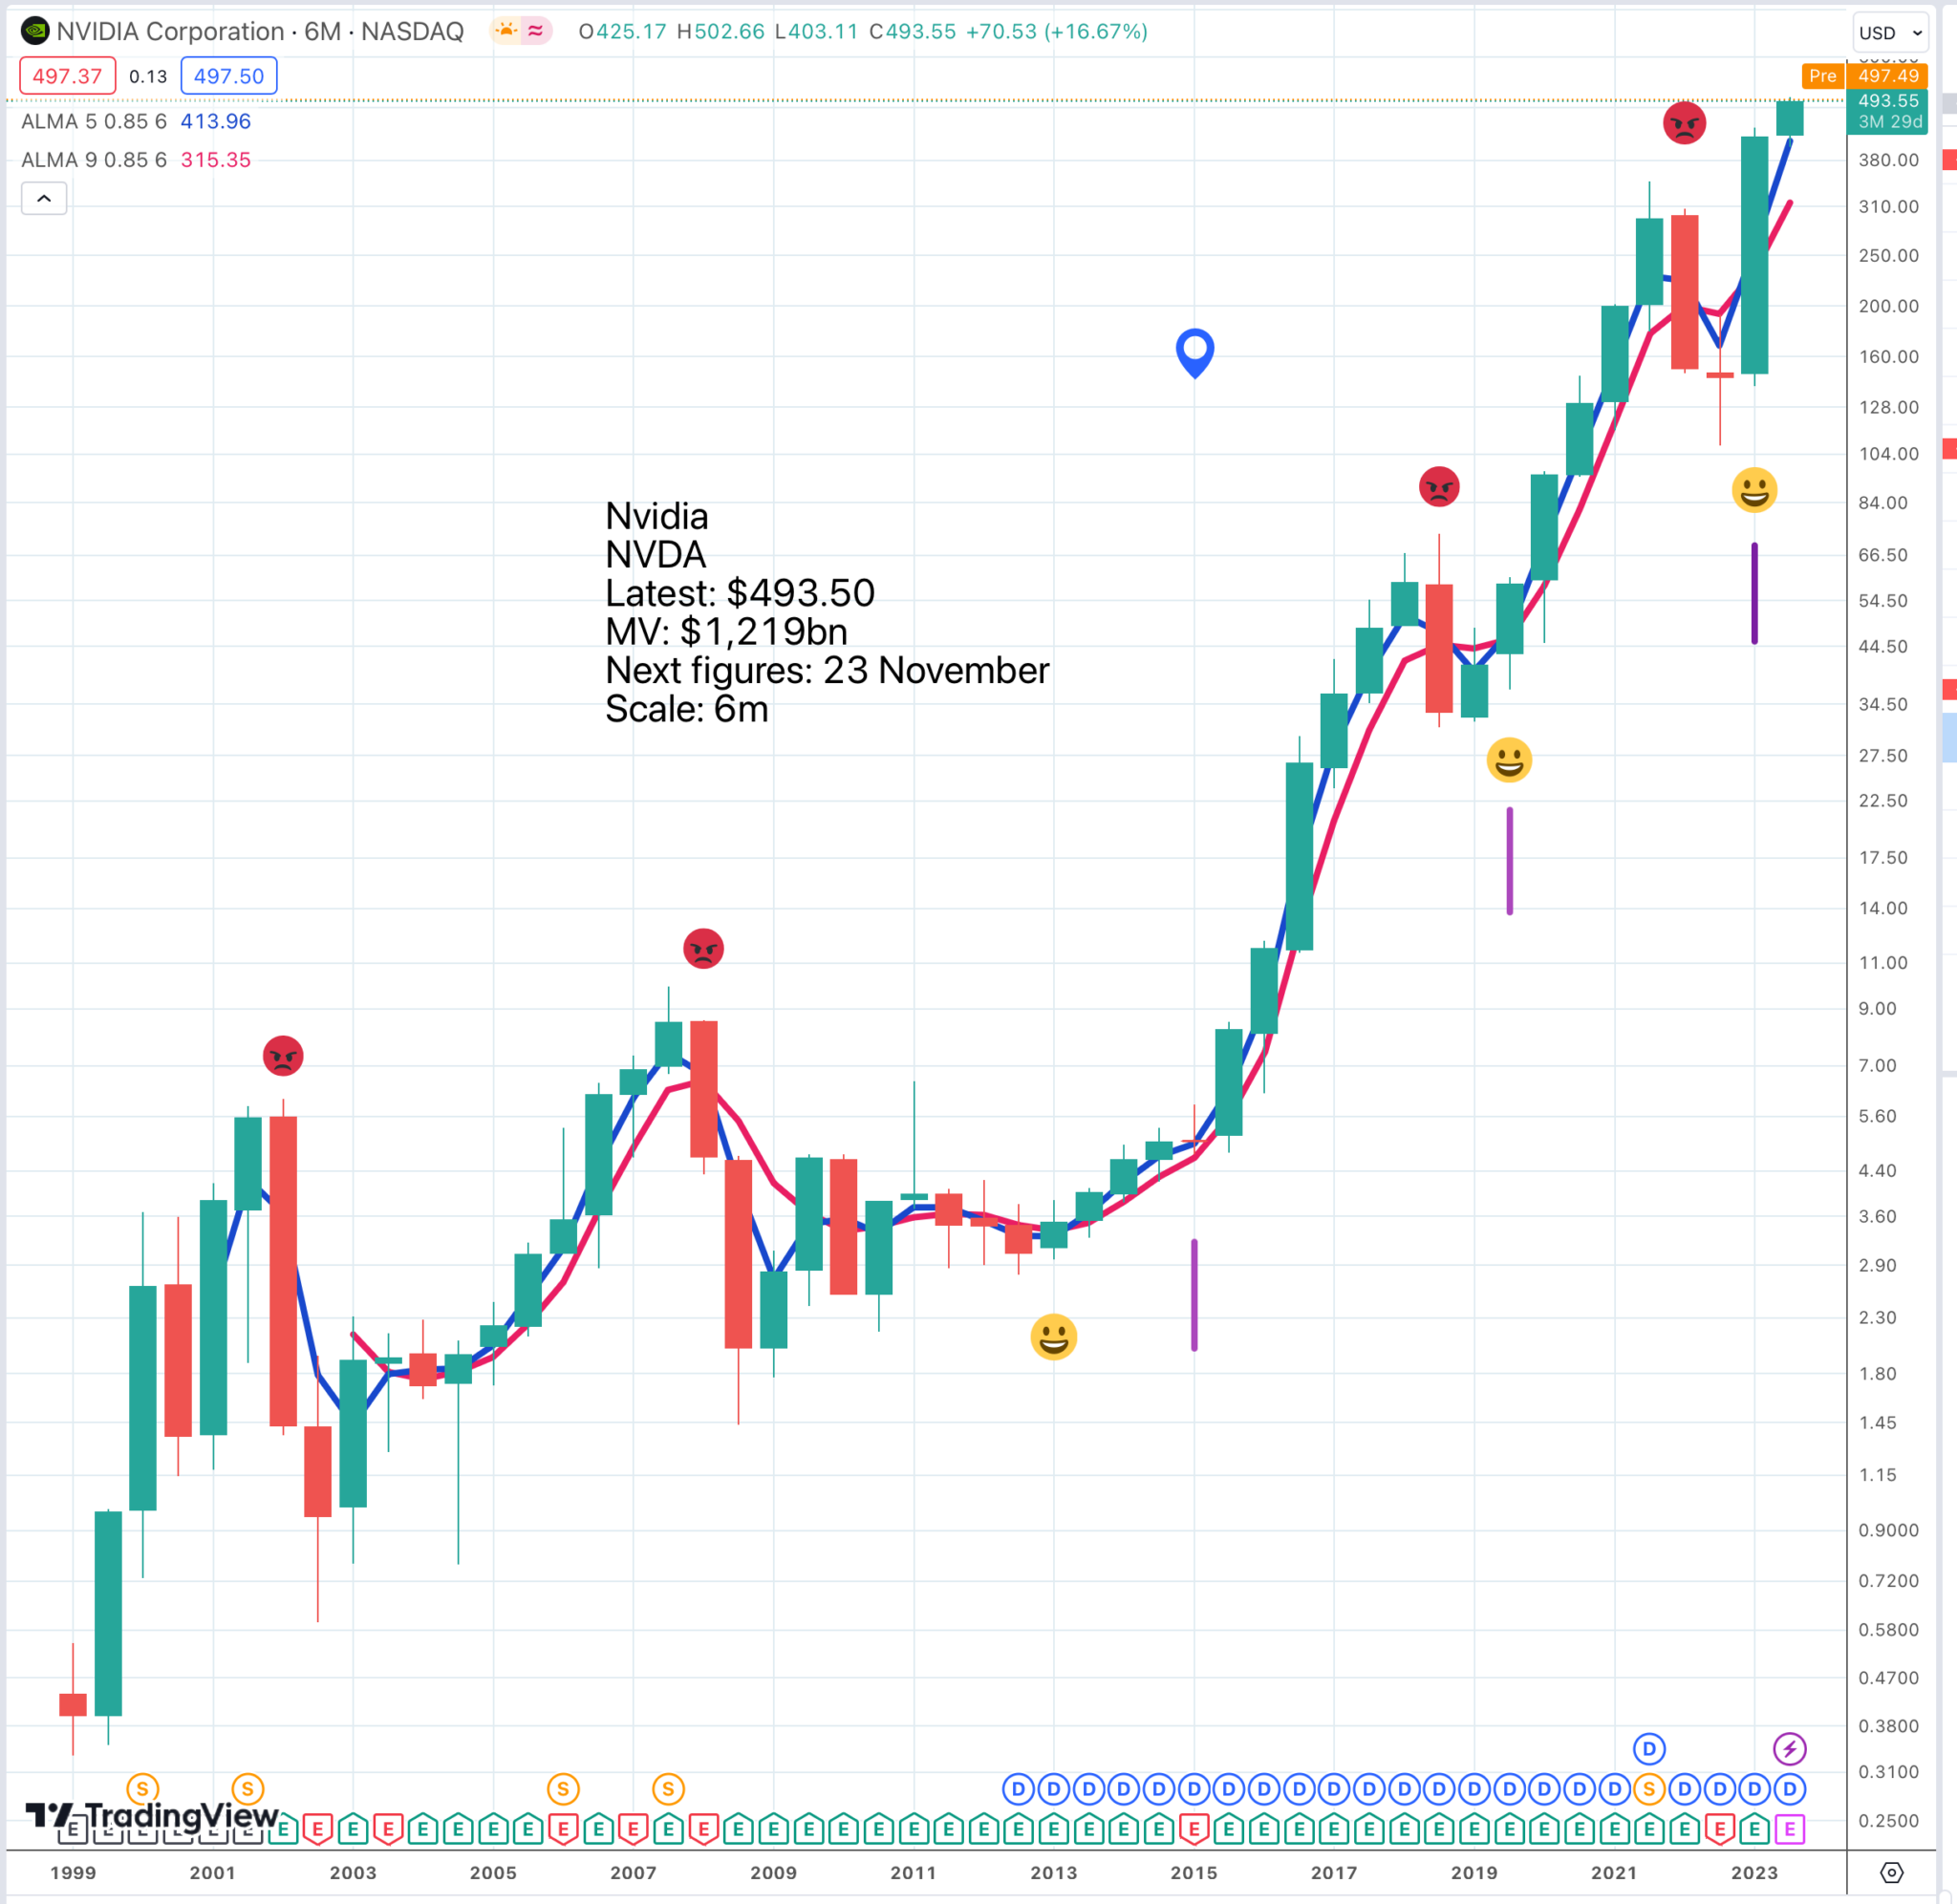
My chart service offers me 21 options for chart periodicity (how long each bar or candlestick represents) ranging between one second and 12 months. My preferred charts are candlesticks for the last three, three months, six months and 12 months. I like them because I am a long term investor and because they really help me to see what is happening.
I have marked buy signals on the chart above with smiling faces and downturns with frowning faces. I am much more concerned with the former. You can see how well they work, especially when teamed up with the Coppock buy signals, marked with a vertical mauve line.
If the Nasdaq is looking good, whether Nasdaq Composite, Nasdaq 100 or Nasdaq 100 Technology, this bodes well for QQQ, an ETF which tracks the Nasdaq 100.

Interestingly the chart for QQQ looks similar but stronger and has climbed roughly 15-fold since 2009, a result which I am sure nobody expected at the time.
An even more exciting version of QQQ is QQQ3, the same thing but three times leveraged and rebalanced daily which adds enormous additional momentum and makes QQQ3 a spectacular performer.

This chart only begins in January 2014 since when the shares are up an incredible 42 times. Trough to peak the shares are up 90 times and history suggests that every sharp reaction is a buying opportunity.
A feature of this market is how much of the performance of the indices is being driven by a group of shares known as the Magnificent Seven.
- Apple
- Microsoft
- Alphabet
- Amazon
- Nvidia
- Tesla
- Meta Platforms
Within that the three most extraordinary performers have been Nvidia, Meta Platforms and Tesla. There is no sign of a loss of momentum by these shares, also known as the Mega Caps. If anything they go from strength to strength with Nvidia recently delivering some of the most spectacular earnings reports in US corporate history.
Subscribe to Quentinvest and you will learn about my Kamikaze strategies for investing in Nvidia. If you are like me and you are investing for spectacular, mind-blowing results then Kamikaze is for you. It is as different from regular investing as driving a Formula One car is from riding a bicycle.
It may sound absurdly risky but it needn’t be because you can achieve incredible results from quite a small upfront investment and I have also developed a technique for taking regular profits which means (a) you can generate an exciting annual income from investing in shares which pay little or nothing in the way of dividends and (b) you are soon playing with profits so none of your original capital is at risk.
Long Term Charts Help Patient Investors

There are two things which interest me about this chart of Tesla. First is the recent buy signal using indicators which I favour such as Coppock and a bullish turn higher by the moving averages. But the other thing which interests me is the scale of the consolidation. Tesla shares have been trading broadly sideways now for approaching three years. There have been two previous consolidations on the chart, each of which prefigured massive advances. It is very possible that something similar could happen again.

We probably need a powerful something new to make this happen but with Elon Musk in charge it is highly likely that this is what we are going to get. There will soon be 5m Teslas on the world’s roads all pumping back crucial data to the company and we know there are some exciting models in the pipeline, let alone all the more futuristic plans for autonomous driving, robots and whatever Musk has in mind for generative AI.
The amusing thing about Musk is that he is so full of plans and ideas and is so often wildly optimistic on timing that it is easy to stop listening but he is a true visionary, who does make things happen and that is what makes it so exciting to invest in Tesla. You never know when he is going to pull a rabbit out of a hat and every year his cash flow and his balance sheet grow stronger.
All those short term investors and day traders miss out on this because what they are doing could be applied to any share. This is why investing is so rarely about value. Who cares what valuation the shares were on back in 2010 when they were trading between $1 and $2. The important thing was Musk, the story and the chart.